The
Educational Achievement of Indian Children
CHAPTER II
Differences In Student
Backgrounds
INTRODUCTION
Since the present study was designed to complete the
cycle begun by the 1946 testing, the information gathered by means
of the Background
Questionnaire in the 1950 study was essentially the same as in
1946. Peterson3 had this to say regarding this phase of the investigation:
A great many statements have been made and articles written describing
the Indian student, often drawing comparisons between him and white
pupils. Good or poor achievement has frequently been explained
on the basis of racial or cultural differences between the two
groups. Up to the time of this study, no service-wide survey has
collected the data needed to draw valid conclusions in regard to:
(1) the actual difference between the achievement of Indian students
and white children from rural areas,
(2) cultural differences between the two groups, or
(3) the relation between achievement and cultural differences.
It may be said therefore that the objective of this survey is three-fold:
(1) to measure the educational achievement of students in Indian
schools,
(2) to gather data relative to the cultural backgrounds of the
Indian and non-urban white students in Indian, public and mission
schools, and
(3) to determine the relationships, if any, which exist between
these measures of cultural background and school achievement.
Practical limitations made it necessary to collect cultural data
on a relatively small number of topics, but those which were selected
for study were those which seemed likely to be most important as
an aid to interpreting the test data and also as indication of
the other information which should ultimately be collected during
the following years of the study.
However, the present study was concerned chiefly with finding an
answer to the question: How well are Indian children educated?
This basic question was broken down into several specific questions
as follows:
1. Is the educational achievement of Indian children in some geographic
areas greater than in others?
2. Is the educational achievement of Indian children in some types
of schools greater than in others?
3. Is the educational achievement of Indian children in the various
types of schools they attend, as great as that of non-Indian children
in rural public schools?
4. What factors are in operation to produce differences in achievement
of Indian children in the different areas, in different types of
schools, and in contrast to non-Indian children in public schools?
5. The superior performance of fourth grade Indian children on
the 1946 tests, led to the tentative conclusion that the more systematically
organized program of instruction keyed to Indian needs, accounted
in large part for this clear-cut superiority, and raised the question
as to whether these same pupils at the eighth grade level would
also show an achievement superior to that of previous eighth graders
who had not had the benefit of basic instruction under the new
Indian school educational program. Therefore, the following question:
On tests common to both the eighth and twelfth grades, what is
the percentage of overlap or what percentage of the students in
the eighth grade exceeded the mean of the twelfth grade?
COMPOSITION OF TYPES OF SCHOOLS BY AREAS
Many of the comparisons that follow later in Chapter 3 will be
more meaningful if one knows the areas represented in the 1950
testing program. Table 2 shows the composition of the types of
schools by areas for the students in grades eight and twelve in
this study. For example, a large proportion of the students in
the eighth and twelfth grades who attended Government reservation
boarding schools lived in the Dakota, Pueblo, and Oklahoma areas.
A majority of the Indian children in the eighth grade in this study
who attended public schools lived in the Mountain and Pacific areas.
CULTURAL BACKGROUNDS OF THE STUDENTS
 Degree of Indian Blood Degree of Indian Blood
Table 3 describes the degree of Indian blood of the students in
the two grade levels in the different types of schools. The Peterson
report also listed the degree of Indian blood according to the
different
geographic areas. This information was also obtained for this report
but since the data were essentially the same as in the 1946 study,
they were not recorded here. The same was true of the information
gathered on other factors considered in this chapter and therefore
it has not been included in this report.
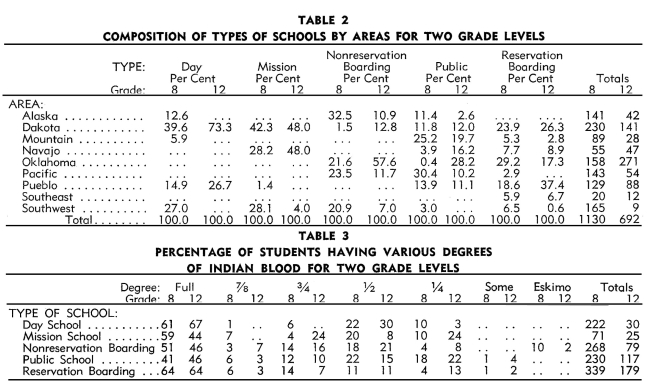
Essentially the some generalizations were obtained with regard
to the degree of Indian blood as in the 1946 report,4 namely:
(1) Nearly all of the students in the Navajo, Pueblo and other
Southwest schools are full blood Indians.
(2) There is a larger percentage of mixed blood students in the
non-reservation schools than in any of the other types of Federal
Indian schools.
(3) The public schools and mission schools selected for comparison
have a fairly wide range of students, extending from the full blood
Indians to all-white students.
Since this report is concerned essentially with comparisons of
achievement of Indian children in the various types of schools
they attended, the third generalization listed above is important.
If the public schools and the mission schools selected had contained
only full blood Indians, it would have been difficult to compare
the achievement of the Indian children in these schools with the
Indian children in government schools where the degree of Indian
blood ranged from full blood to some Indian blood. This is assuming
that the degree of Indian blood is a factor in school achievement.
The evidence presented in the 1946 study with regard to this question
was inconclusive.
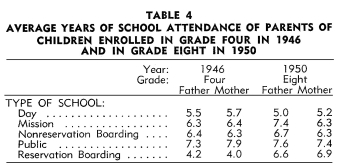
Education of Parents
Table 4 indicates the average years of school attendance of parents
of children enrolled in the fourth grade in the 1946 report and
the eighth grade in this report. The educational attendance of
the parents of the students in the twelfth grade in 1950 was not
available. Peterson concluded that the “students coming from
homes in which parents have had the advantage of considerable education,
tend to remain in school longer than those coming from homes where
the parents have had little or no schooling.”5 Table 4 neither
confirms nor denies Peterson's conclusion. However, the parents
of Indian children enrolled in the public schools had the highest
average years of school attendance when compared with parents of
Indian children enrolled in the other four types of schools.
A study of drop-outs in the Lawrence Junior High School, Lawrence,
Kansas,6 revealed that the average school grade reached by the
mothers was 8.1 and that reached by the fathers was 7.7. Both of
these values are higher than those listed for the Indian children
in grade eight in Table 4. The average school grade reached by
the parents of all junior high school students in the Lawrence
school would be much higher.
In a study of a representative group of North Central High Schools
in Kansas, about eighty-eight per cent of the adults, in the communities
in which these schools were located, had completed the elementary
school or higher.7
Any conclusions, therefore, regarding the achievement of Indian
students in the various schools and white students in public schools
should be tempered by the fact that the educational level reached
by the parents of Indian children is probably considerably less
than that reached by the parents of white children in public schools.
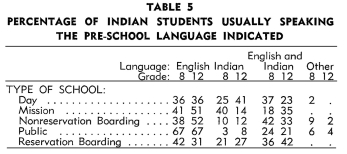
Language Spoken in the Home
Table 5 describes the pre-school language usually spoken by the
eighth and twelfth grade Indian students in the 1950 study. Peterson
had this to say about the language spoken in the homes of Indian
children in the 1946 study:"8
It should be noted that this represents the language which the
student reported as that which is actually spoken in the home?not
the homes in which one or both parents can talk and understand
enough English to converse in that language if necessary. There
is evidence that many students who, because they speak English
habitually around school and are thought of as English-speaking,
actually speak only Indian when they are at home. It is also apparent
that many adult Indians who speak perfectly good English when necessary,
elect to converse in their Indian language at home. It will be
noted that the students in day schools come from homes in which
less English is spoken than do the students in any of the other
types of Indian schools. As would be expected, the public school
children have by far the greatest amount of English spoken in their
homes. This is true for Indian students in public schools, as well
as for whites in public schools. A much greater proportion of English
is spoken in the homes of the twelfth grade students in Indian
schools, and the proportion for the eighth grade is greater than
that for the fourth grade. The language spoken in the home appears
to be correlated with school achievement and also with the number
of years the student remains in school.
Although the information was not available, observations have indicated
that English was the predominant language spoken in the homes of
white children in the public schools in this study. Therefore,
any conclusions regarding the achievement of Indian students in
the various schools and white students in public schools should
be tempered by this fact.
Home Stability
Table 6 describes the home stability of the students in the eighth
grade by indicating the percentage living with their parents, with
only their father, with only their mother, with relatives, or with
others. Data for the twelfth grade were not available. The following
statement appeared in the 1946 study:9
These data do not appear to have a direct or easily interpretable
relationship with any of the achievement scores, or with home factors
studied, but they will probably prove of value and interest in
personnel and adjustment studies. For example, the percentage of
students living with both parents is much smaller among students
in non-reservation boarding schools than in any other type of school.
* The data do not indicate, of course, that the broken home is
never a factor in the poor achievement of an individual student,
but they do indicate that, whatever the adverse effects of a broken
home may have been among these students, they are concealed by
other factors more directly affecting achievement.
*Dependency because of a broken home is one criterion for admission
to a non-reservation boarding school.
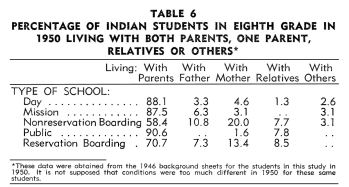
The important thing to note in Table 6 is that the percentage of
students falling into the various categories did not differ too
widely in the various types of school which these Indian children
attended. If home stability is a factor in school achievement,
the students who attended the non-reservation schools should not
have achieved as much as students who attended the other types
of schools. Although the data were not available, observations
indicate that a greater percentage of the white children in the
public schools in this study lived with their parents than was
true of the Indian children in the various schools. This factor
must be considered when comparing the achievement of Indian children
in the various schools and white children in the public schools.
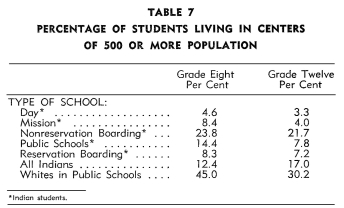
Permanent Residence
Table 7 indicates the percentage of students in the various types
of schools living in urban centers of 500 or more population. The
Indian children enrolled in the non-reservation boarding schools
and in the public schools lived in population centers more urban
than the Indian children who attended the other types of schools.
A much greater percentage of the white children in public schools
in this study lived in urban centers than was true of Indian children
in any of the types of schools they attended. Certain cultural
advantages are open to youngsters living in urban centers that
are not available to those living in rural areas. It would be expected
that Indian children living in urban centers might assimilate the
white man's culture more rapidly than Indian children living in
rural areas. Any conclusions, therefore, regarding the achievement
of Indian children and white children in public schools should
take the facts revealed in Table 7 into consideration.
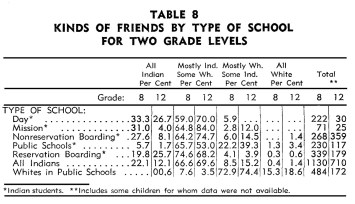
Kinds of Friends
Table 8 reveals percentages of the kinds of friends of Indian children
who attend the various schools for Indians and the kinds of friends
of white children who attend the public schools included in this
study. If contact with white children is a factor in school achievement,
then the Indian children attending the public schools should achieve
more than the Indian children attending the other types of schools
for Indian children. The Indian children in the twelfth grade in
this study apparently have more contact with white children. Therefore,
if contact with white children is a factor in school achievement,
then the Indian students in the upper grades should compare more
favorably with white children in school achievement than the Indian
children in the lower grades.
EDUCATIONAL CHARACTERISTICS OF THE STUDENTS
Grade Placement and School Attendance
Table 9 shows the average age of the students in grades eight and
twelve in the 1950 study. These values are almost identical with
those given in the 1946 study. However, the percentages of students
accelerated in the eighth and twelfth grades in 1946 were 4.5 per
cent and 15.9 per cent respectively,10 as contrasted to 9.5
per cent and 17.3 percent respectively in the 1950 study. However,
the gain in acceleration in the eighth grade was offset by an increase
in retardation, the percentage of retardation being 6.8 per cent
in 1946 as contrasted to 13.2 per cent in 1950. In the twelfth
grade in 1950, there was an increase in the percentage of students
accelerated and in the expected age group and a decrease in the
percentage of students retarded when compared with the values given
in the 1946 study. Whether or not this trend represents a change
in promotional policy or a dropping out of less capable students
was not revealed by the information gathered.
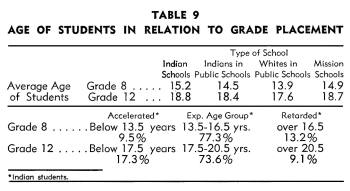
Table 10 indicates the number of years of school attendance in
relation to grade placement. The average number of years of school
attendance was almost identical with that reported in the 1946
study.11 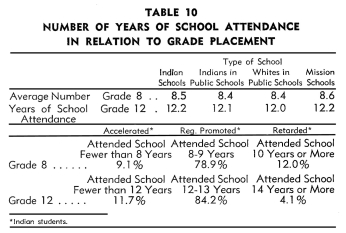
Here again the comparison with regard to accelerated, regularly
promoted, and retarded students is almost the same as mentioned
previously with regard to Table 9.
In a study of a group of Kansas North Central high schools,12 the
percentage of over-ageness decreased from grades nine to twelve,
while the percentage of youngness increased. This trend noted in
Tables 9 and 10 for Indian children is typical of white children
in the public schools. The decrease in the percentage of retarded
students in the upper grades may be partially explained by acceleration
during the interval or because more of the students now entering
have difficulties that result in early retardation.
The percentage of students in the twelfth grade in the Kansas North
Central high schools who were older than 17.5 years, was 17.6 per
cent. The percentage of students in the twelfth grade in the Indian
schools in this study who were over 17.5 years was 82.8 per cent.
Thus, it is apparent that the Indian students in the twelfth grade
in this study were considerably retarded when compared with white
students in typical public high schools. There are many reasons
for this retardation, the chief one probably being the late entrance
of many Indian students in school. Thus, any conclusions regarding
the achievement of Indian students in the various schools with
white children in public schools must be tempered by differences
in the ages of students in relation to their grade placement.
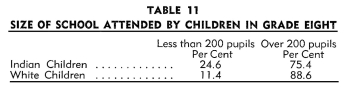
Size of School Attended
Table 11 presents some information regarding size of school attended
by Indian children, and white children in public schools. The number
of cases for grade twelve for white children in public schools
was far too few to make a comparison. Two studies13, 14 have shown
the size of the school to be a factor in school achievement. These
studies demonstrated that students in schools of less than 100
pupils did not achieve as much in certain subjects as pupils in
schools enrolling from 100 to 500 students. Whether or not this
factor played a role in this present study is not known, but it
might well have affected the Indian students.
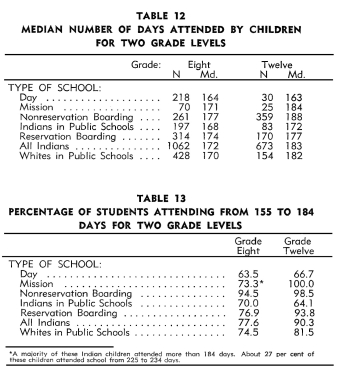
School Attendance
Table 12 shows the median number of days attended by Indian children
in the various schools and by white children in public schools.
Table 13 gives the percentage of Indian children in the various
schools and white children in public schools that attended from
155 to 184 days. It is apparent from these two tables that Indian
children in the non-reservation boarding schools have the best
record of attendance while the Indian children in the day schools
have the poorest record of attendance. However, the attendance
figures as given here for Indian children compare favorably with
those of white children in the public schools in this study. If
attendance is a factor in school achievement, then Indian children
attending non-reservation boarding schools should achieve the
most and Indian children attending day schools
should achieve the least. This is merely an interesting hypothesis,
which might be explored in a study planned to test out the hypothesis.
Males and Females Enrolled
Table 14 indicates the percentage of male and female Indian children
enrolled in the various schools and the percentage of male and
female white children enrolled in the public schools in this study.
These figures would seem to indicate that the schools which Indian
children attend are holding more girls than boys in school. This
trend is more evident with regard to white children in the public
schools. The latest enrollment figures for the nation show that
about 430,000 more girls than boys go to high school, despite the
fact that there are more boys than girls of high school age."15 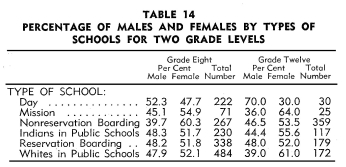
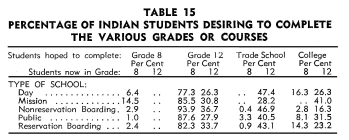
Academic Ambition
Table 15 indicates the percentage of students desiring to complete
the various grades or courses. The some kind of information was
not available for the white children in the public schools in this
study, but it would be supposed that the academic ambition of the
white children would be higher than that of the Indian children.
Furthermore, it would be supposed that academic ambition would
be a factor in school achievement. Whether or not this factor played
a role in this study is not known.
SUMMARY
A number of factors seemingly related to school achievement have
been cited and discussed. If these factors affected school achievement
as measured in this study, they did so to produce differences in
achievement:
(1) among Indian children attending the different types of schools
or living in different geographic areas, and
(2) of Indian children when contrasted to white children in public
schools.
These factors and many more, tend to operate in two directions.
This complicates rather than simplifies the problem of answering
the question, how well are Indian children educated?
Some of the factors discussed operate in varying degrees of intensity
on different groups of Indian children to produce less school achievement
than that attained by white children in the public schools. Some
of these factors are: degree of Indian blood, language spoken in
the home, home stability, place of residence, kinds of friends,
late entrance to school, size of school attended, regularity of
school attendance, and academic ambition. Any conclusions, therefore,
regarding the school achievement of Indian children as contrasted
to the school achievement of white children in public schools must
be tempered by the fact that these factors may tend to operate
against Indian children. Some may argue that the influence of some
of these factors on school achievement has not been definitely
established. Until research proves differently, we can only be
mindful of the differences in the cultural and educational backgrounds
of Indian children as contrasted to white children in public schools.
3 Peterson. op. cit. p. 27.
4 Peterson, op.cit. p. 29.
5 Peterson, op cit. p. 30.
6 Review and Preview, Secondary School
Studies of Drop-Outs, Hidden Tuition Costs, Junior High Activity
Program.
Lawrence Junior High School, Liberty Memorial High School, Lawrence,
Kansas. (In cooperation with the School of Education, University
of Kansas) 1950-51.
7 Kenneth E. Anderson. A Summary Report
to the North Central Schools of Kansas on Criterion I. (Mimeographed
Bulletin) School
of Education, University of Kansas, 1949, p. 16.
8 Peterson.
op. cit. pp. 31-32.
9 Peterson. op.cit. pp. 33-34.
10 Peterson. op. cit. p. 34.
11 Peterson. op. cit. p. 34.
12 Kenneth F.
Anderson. A Summary Report to the North Central Schools
of Kansas on Criterion 1, p. 13.
13 Kenneth E. Anderson. "A Frontal Attack
on the Basic Problem in Evaluation." Journal of
Experimental Education, 18 (March 1950) 163-174.
14 Jim Schunert. "The
Association of Mathematical Achievement with Certain Factors
Resident in the Teacher, in the Teaching,
in the Pupil and in the School." Journal of Experimental
Education, 19 (March 1951) 219-238.
15 EIIsworth Tompkins. "Where Are the
Boys?" School and Society, 70 (July 2, 1949) 8-10.
|