The Indian Child Goes To School
APPENDIX C
Determining the Race-School Hierarchy of Achievement
| Table C-la |
Comparison of Race-School Groups Within Each Area on All
Skills and Total Score Using Ranks Converted to Normalized
T-Scores |
| Table C-1b |
Comparison of Means of Normalized T-Scores Assigned to Ranks
of Race-School
Groups |
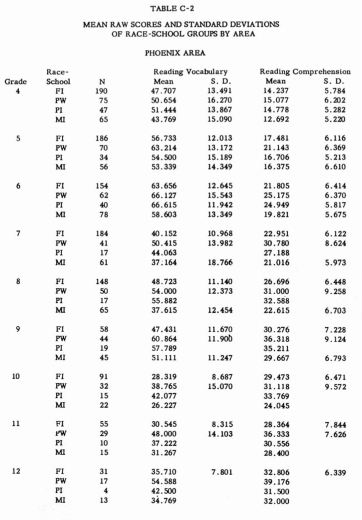
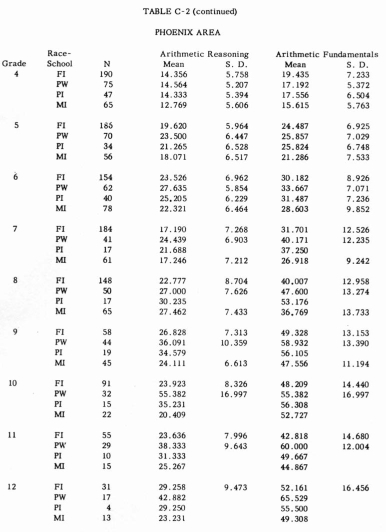
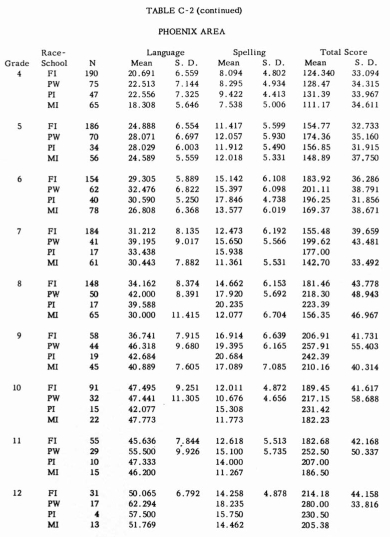
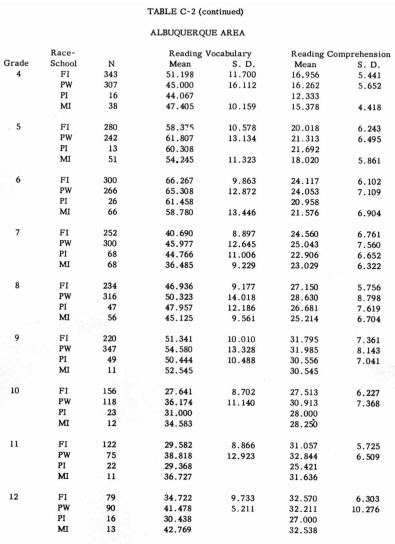
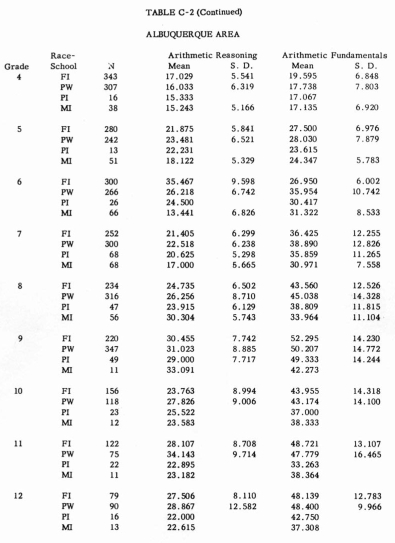
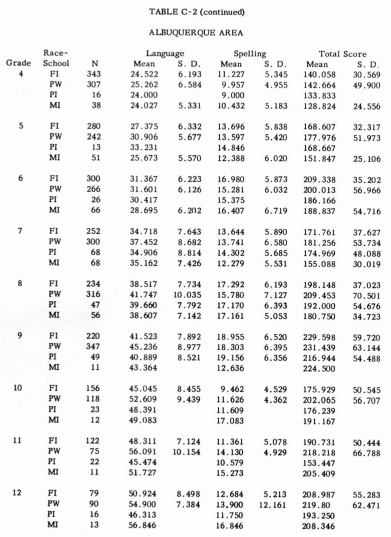
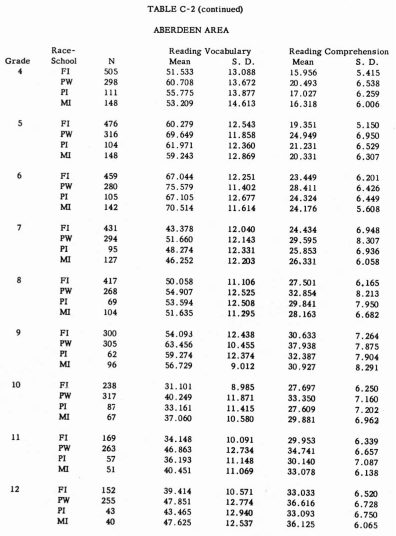
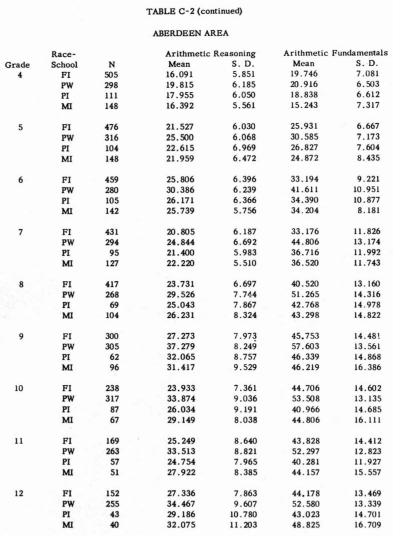
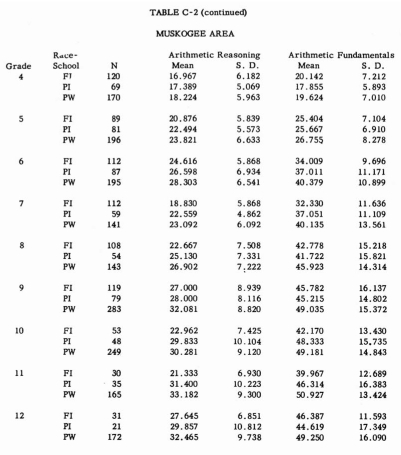
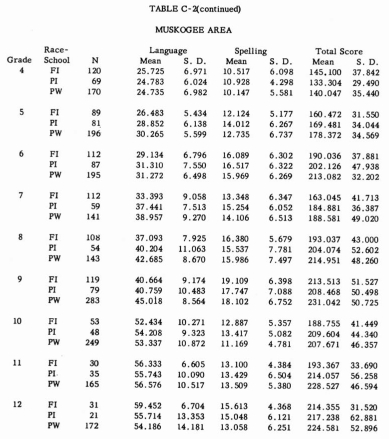
| Table C-2 |
Mean Raw Scores and Standard Deviations of Race-School Groups
by Area |
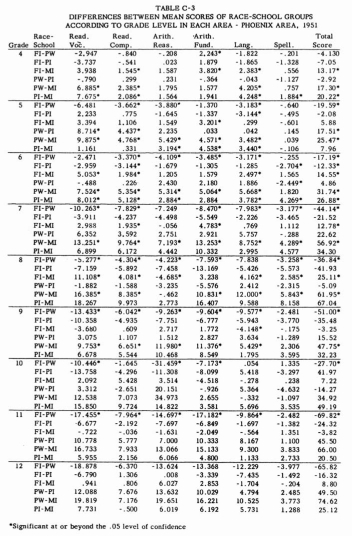
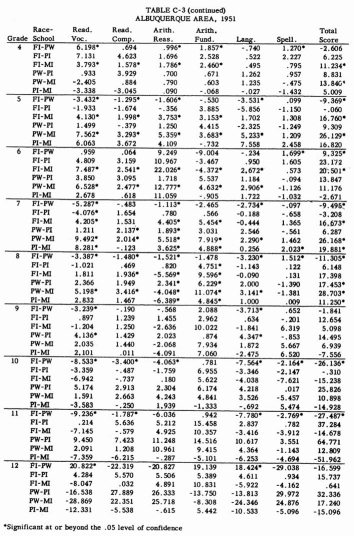
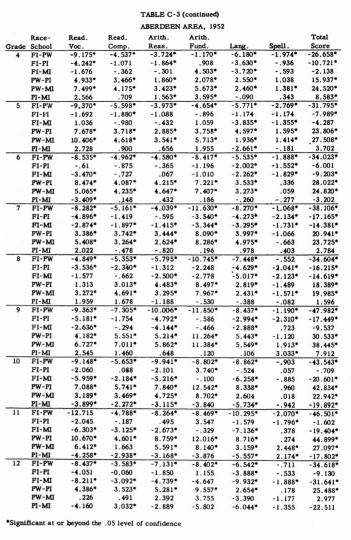
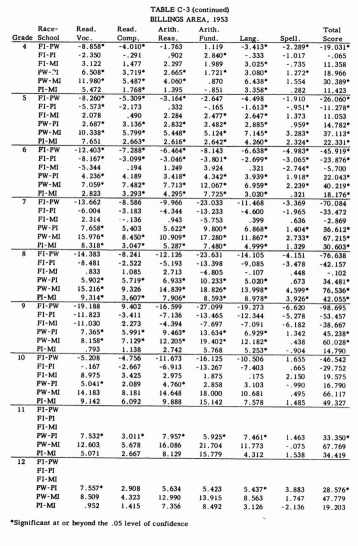
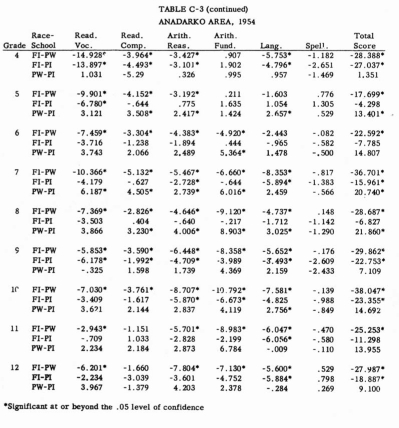
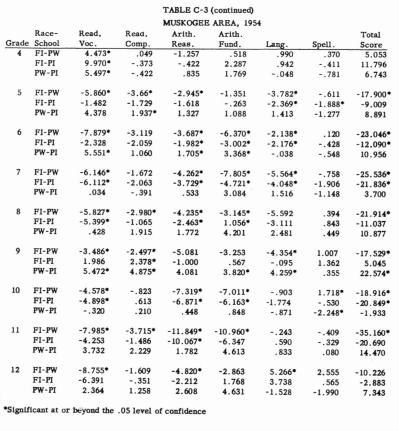
| Table C-3 |
Differences Between Mean Scores of Race-School Groups According
to
Grade Level in Each Area |
DETERMINING THE RACE-SCHOOL HIERARCHY OF ACHIEVEMENT
The same method was used to obtain a general hierarchy of race-school
group achievement in each area as was used to obtain the area hierarchy.
The method was described in detail in Appendix B. There were four
race-school groups in each area except in the two Oklahoma areas,
where no mission schools participated. The standard scores assigned
to groups of three and four ranks are as follows:
Rank of l
2
3
4 |
60
50
40 |
62
53
47
38 |
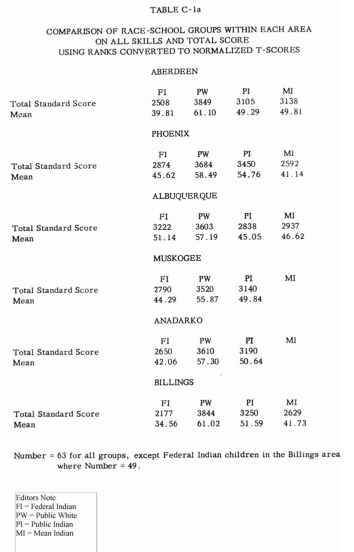
The mean standard score of each race-school group in each area
is shown in Table C-la. Sixty-three ranks were utilized to obtain
the mean standard score
assigned to the ranks of all the race-school groups, with the exception of
Indian children in Federal schools in the Billings area. In that area there
were too few Indian children in Federal schools beyond the tenth grade to
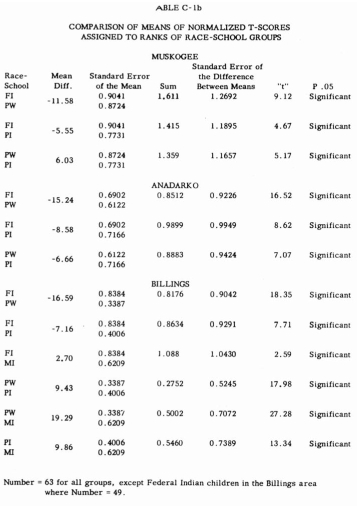
utilize them. Tests for significance between mean standard scores
were made between
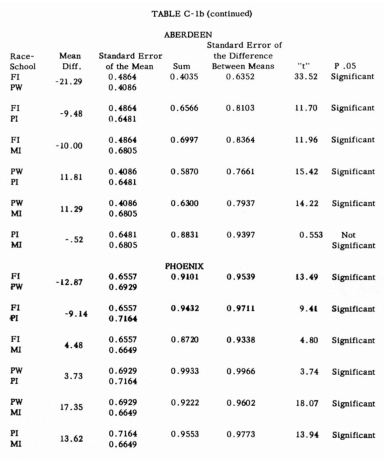
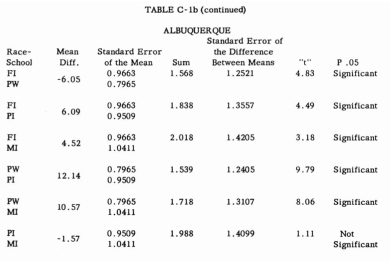
the groups (Table C-1b). All comparisons within an area, with but two exceptions,
exceeded the .01 level of confidence, to indicate the high probability that
the differences were due to other than chance variation. The two exceptions
both involved the same two race-school groups, Indian children in public
and mission schools, in the Aberdeen and Albuquerque areas. In
both cases the probability
exceeded .05, indicating a relatively high probability that the differences
were due to chance variation.
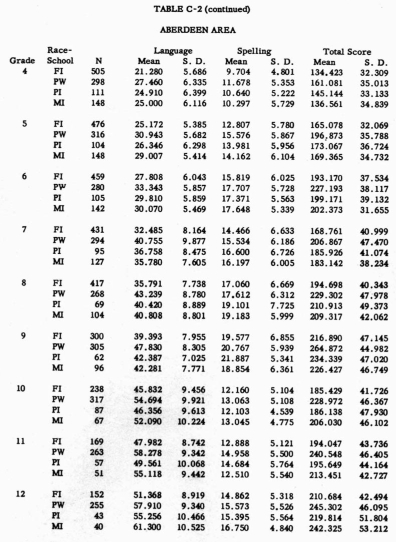
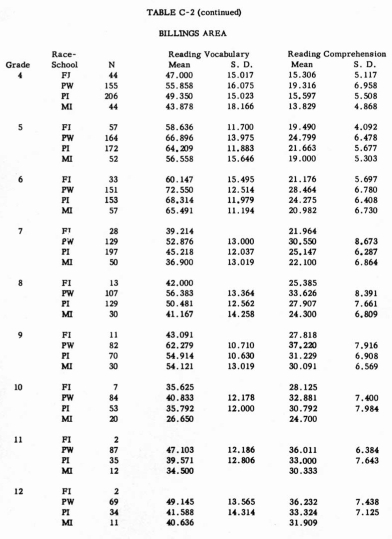
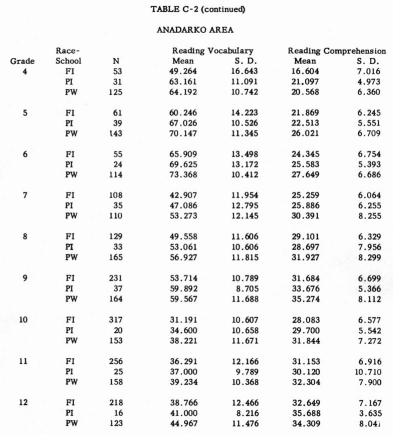
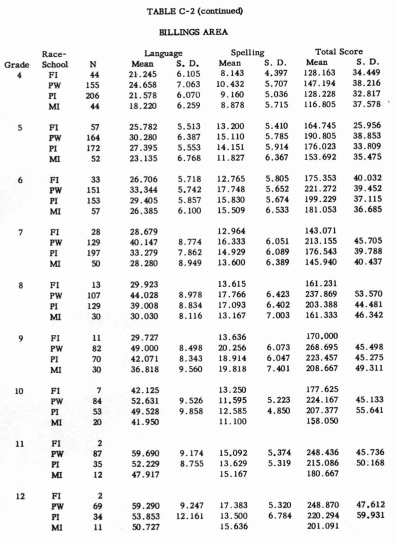
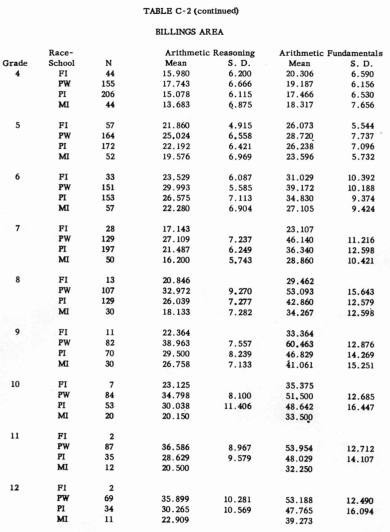
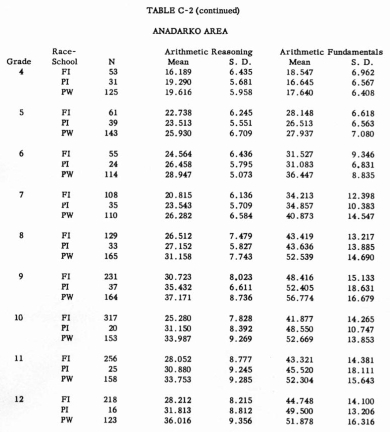
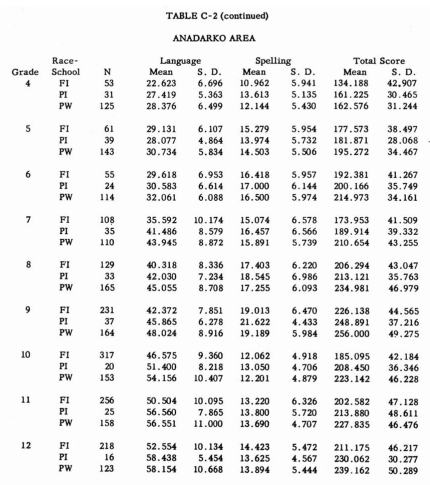
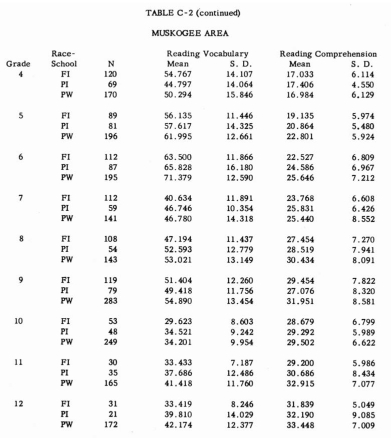
Table C-2 provides the mean raw scores and the
number in each race-school group in each area on each test for every grade.
By an inspection of this table one may see how the standard scores were
assigned since the highest mean for a grade in an area was given
a rank of one, and so on.
Tests of significance of difference between
mean raw scores of race-school groups in an area were made. The
results of these tests are shown in Table
C-3.
|