|
AN ANALYSIS OF ACADEMIC ACHIEVEMENT
OF INDIAN HIGH SCHOOL STUDENTS IN FEDERAL AND PUBLIC SCHOOLS
I. INTRODUCTION
The major concern of this longitudinal study was
to determine whether academic achievement differs significantly
for American Indian
students enrolled in four types of schools: (1) federal on-reservation,
(2) federal off-reservation, (3) public on-reservation, (4)
public off-reservation. Other important interests were to examine
differences
in academic achievement by geographic area, grade, and sex.
In addition, it was the purpose of the study to gather a variety
of data on other psychological and sociological variables and
to investigate the relationship of some of them to achievement.
Of the numerous studies that have been made of academic achievement
of American Indian students, only a few have examined levels
of achievement in various types of schools, notably the extensive
study by Coombs who found that Indian students who were enrolled
in public schools achieved at a higher level on the average than
did those enrolled in Bureau of Indian Affairs (BIA) schools.
However,
since initial individual differences were not controlled statistically,
differences in group achievement could not be attributed to the
educational experiences provided to students by the schools.
Although Coombs was careful to point out that differences in
socioeconomic
backgrounds of the students in the groups being compared may
have accounted for the disparity in achievement levels, it
became almost
axiomatic, as a result of the findings of the study, that an
Indian student would make greater academic progress in a public
school
than in a BIA school. 1
In this present study, individual differences were taken into
consideration in comparing academic achievement of various groups.
To provide
a measure of control of individual differences influencing achievement
the statistical technique of analysis of covariance was employed
so that the differences in achievement could be attributed to
the treatments being tested.
II. METHOD
The Sample
In the fall of 1966 a sample of American Indian high school students
was drawn from 21 schools located in the seven states of Alaska,
Arizona, Nebraska, New Mexico, Oklahoma, South Dakota, and Utah.
Approximately equal numbers were drawn from each of the four school
types: federal on-reservation, federal off-reservation, public
on-reservation, and public off-reservation. The sample was also
stratified on the basis of sex, grade, and geographic area, with
approximately equal numbers of male and female, and with 34% coming
from grade nine, 28% from grade ten, 20% from grade eleven, and
18% from grade twelve. The sample included all Indian students
enrolled in certain schools and a random selection of students
from other schools and was drawn so as to provide representation
from certain Bureau of Indian Affairs administrative areas proportionate
to the numbers of students enrolled in federal schools in those
areas. This sample, numbering 3,346 students, was pretested in
the fall of 1966. In the spring of 1967 testing sessions were held
again in all of the same schools, at which time it proved possible
to obtain usable post-test results for 2,584 of those who had been
pretested in the fall. This group of 2,584 subjects, who were administered
both pretests and post-tests, then comprised the sample for the
first year of the study.
Insufficient time to make necessary arrangements, considering certain
difficulties encountered, made it impossible to include public
school native Alaskan students in the sample for the first year
of the study. However, this situation was corrected and students
enrolled in two public schools were added to the sample for the
succeeding years of the study.
In the fall of 1967 a total of 3,375 Indian students was tested.
Of these, a substantial number were ninth grade students brought
into the sample for the first time, while the others were principally
students who had been tested the previous school year. In the spring
of 1968 a total of 2,556 Indian students was tested. Of this number,
complete and usable data for both the fall pretest and the spring
post-test were obtained for 1,928 Indian students.
The next testing session was held in the spring of 1969. No new
ninth grade students were added to the sample at this time. Data
were sought only on students who had been tested at some prior
time in the study. This, of course, limited the spring of 1969
sample to tenth, eleventh, and twelfth grade students. Data were
obtained for 1,377 students in the 1969 spring testing.
The final testing was accomplished in the spring of 1970, and again
was confined to students who had been tested previously, thus limiting
the sample to eleventh grade and twelfth grade students. Of the
1,377 students tested in the spring of 1969, it was possible to
test 837 again in the spring of 1970.
Measuring Instruments
The following tests were administered during the course of the
study.
Fall 1966
California Achievement Tests (CAT), Advanced, Complete Battery,
1957 Edition, 1963 Norms, Form W.
California Short-Form Test of Mental Maturity (CTMM), 1963 Level
4.
Mooney Problem Check List (Abbreviated Version), Form J-SH.
Questionnaire.
Spring 1967
CAT, Form X.
Fall 1967
CAT, Form Y.
CTMM. Administered to all ninth grade students and to Alaska public
school students, grades 10-12, new to the sample.
Questionnaire. Administered to all ninth grade students and to
Alaska public school students, grades 10-12, new to the sample.
Semantic Differential.
Spring 1968
CAT, Form W.
School Interest Inventory, by William Cottle, published by Houghton
Mifflin Company, 1966.
Spring 1969
CAT, Form X.
California Psychological Inventory. Five measures: CS (Capacity
for Status), SP (Social Presence), AC (Achievement via Conformance),
SA (Self-Acceptance), and AI (Achievement via Independence).
Value Orientation Scale.
Spring 1970
CAT, Form Y.
Vocational Aspiration Scale.
Testing Procedures
Each of the six testing sessions was completed in one day at each
school. All testing each fall was accomplished within a period
of about two weeks during late September and early October. Spring
testing was done during the latter half of April.
In each geographic area testing was under the supervision of a
trained and experienced psychometrician who either administered
the tests or trained and supervised others, all of whom had previous
experience in testing.
Analysis of Data
In comparing groups within the sample on the basis of academic
achievement, post-test California Achievement Test (CAT) raw scores
were used as a criterion and differences in means were tested for
significance by analysis of covariance. Since individual differences
in scholastic aptitude and in academic ability could conceivably
influence criterion scores, pretest intelligence and achievement
scores were used as control variables. The California Test of Mental
Maturity (CTMM) intelligence quotient scores were used as a scholastic
aptitude control, and the pretest California Achievement Test (CAT)
raw scores were used as a prior achievement control.
III. ACADEMIC ACHIEVEMENT BY SCHOOL TYPES
One-Year Analyses
Since achievement tests were administered at six different points
within a span of four school years it was possible to analyze achievement
for the following one-year periods:
Fall 1966 (pretest) - Spring 1967 (post-test)
Fall 1967 (pretest) - Spring 1968 (post-test)
Spring 1968 (pretest) - Spring 1969 (post-test)
Spring 1969 (pretest) - Spring 1970 (post-test)
Table 1 presents the mean raw scores of the criterion and control
variables for reading, mathematics, language, and total battery,
by school types, for ninth grade students who were pretested in
the fall of 1966 and post-tested in the spring of 1967. Also presented
in Table 1 are analysis of covariance figures and adjusted criterion
means.
The F scores of 12.82, 18.73, 4.67, and 19.84 with 3 and 868 degrees
of freedom are all significant beyond the 1% level. Therefore,
there is little doubt that the ninth grade students enrolled in
the four types of schools differed significantly in achievement
during the 1966-67 school year. Since significant F values were
found, it is appropriate to compute adjusted criterion means for
each school type. In similar succeeding tables, whenever differences
in criterion means are not found to be significant, adjusted means
are not presented.
In order to avoid burdening the body of the report with tables,
the remaining mean raw scores, analysis of covariance, and, where
appropriate, adjusted criterion means, by grade and school type,
for each of the one-year measurement periods are presented in Tables
A1- A12 in Appendix A.


A compilation of the adjusted criterion means found in Table 1
and in Tables A1 - A12 is presented in Table 2. Rankings, by
school types, are indicated in parentheses. Those categories
for which achievement differences between school types were found
not to be a significant (11th grade reading in 1966-67, 12th
grade reading in 1966-67, 10th grade reading in 1967-68, etc.)
are marked with the letter x.
An inspection of Table 2 reveals that significant achievement differences
between school types occurred for only 18 of the 52 categories.
A summary of the rankings appearing in Table 2 is presented in
Table 3. The sums of the ranks (∑R) reveal that the general ranking
of school types from highest to lowest was: federal on-reservation
(31),federal off-reservation (39), public on-reservation (53),
public off-reservation (57).

To test the differences in ranks for significance the Friedman
Test, a form of rank order analysis of variance was employed. The
formula is

where k is the number of rankings made (18) and n is the number
of objects being ranked (4).
Then 
Reference to an X2 table reveals that
a value of 14.66 with k-1=17 degrees of freedom is not significant
at the .05 level.
To summarize, when individual differences in scholastic aptitude
and academic ability were controlled, significant differences in
one-year academic achievement between school types were found for
only 18 of 52 categories of measurement and differences in the
rankings of school types on those 18 categories were not significant.
Apparently, academic achievement did not differ significantly between
the four types of schools for the one-year time periods.
Two-Year Analyses
Achievement, by school types, was analyzed for the following two-year
spans:
Fall 1966 (pretest) - Spring 1968 (post-test)
Fall 1967 (pretest) - Spring 1969 (post-test)
Spring 1968 (pretest) - Spring 1970 (post-test)
Tables A13 - A20 in the Appendix present the means of criterion
and control variables, analysis of covariance and, where appropriate,
adjusted criterion means, by school types, for each of the two-year
measurement periods.
A summary of adjusted criterion achievement means by school types
for two-year periods, taken from Tables A13 - A20 in the Appendix,
is presented in Table 4. Significant differences in achievement
between types of schools were found for 17 of the 32 categories
of measurement, while differences were found not to be significant
for 15 categories.
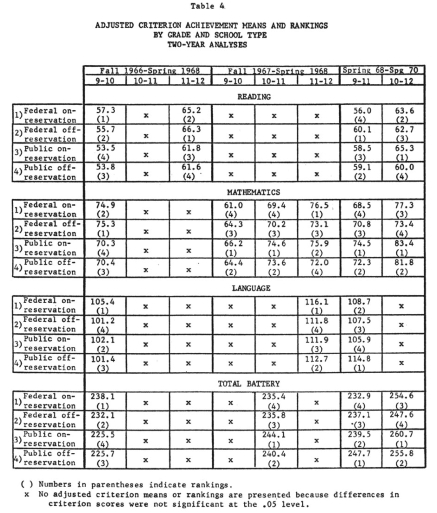
Table 5 presents a summary of the rankings from Table 4. Based
upon the sums of the ranks (∑R) in Table 5, the general ranking
of school types from highest to lowest was: public on-reservation
(38) public off-reservation (42), federal on-reservation (43),
federal off-reservation (47) However, differences in ranks which
obviously are very slight, proved to be non-significant. Use of
the Friedman Test yields an X2 of only 1.44. With 16 degrees of
freedom, this value falls far short of the X2 of 26+ necessary
for significance at the .05 level.

The evidence indicates that when individual differences in scholastic
aptitude and academic ability were controlled there were not significant
differences in two-year academic achievement between school types
for 15 of the 32 categories measured, while for the 17 categories
for which significant differences were found the rankings of school
types were so mixed that no significant pattern of superiority
emerged. Obviously, the two-year analyses do not indicate that
academic achievement differed significantly between the four types
of school.

Three-Year and Four-Year Analyses
Achievement by school types was also analyzed for the following
three-year and four-year spans of time:
Fall 1966 (pretest) -Spring 1969 (post-test)
Fall 1967 (pretest) - Spring 1970 (post-test)
Fall 1966 (pretest) - Spring 1970 (post-test)
Tables A21 - A25 in Appendix A present the means of criterion and
control variables, analysis of covariance and, where appropriate,
adjusted criterion means, by school types, for each of the three-year
measurement periods and for the four-year period.
A summary of adjusted criterion achievement means of school types
for three-year and four-year time spans is presented in Table 6.
There were no significant differences in achievement between the
four types of schools for the four-year period from the fall of
1966 to the spring of 1970. The three-year analyses yielded significant
F scores for 10 of the 16 categories. However, the orders of rank
on the 10 significant categories are very mixed and favor the two
public school types only slightly, as can be seen by reference
to the sums of the ranks in Table 7.

Testing the differences in ranks for significance with the Friedman
Test yields an X2 of only 0.96, which falls far short of the figure
of 16.9 necessary for significance at the .05 level. Since differences
in achievement between the four school types were found to be non-significant
for 6 categories and the ranks of the school types did not differ
significantly on the 10 categories for which significant achievement
differences were registered, it appears that academic achievement
did not differ significantly between types of schools during the
three-year periods.
Summary of Analyses of Academic Achievement by School Types
On the basis of adjusted criterion means, which were calculated
for those categories having significant differences, federal schools
ranked higher than public schools on one-year analyses, public
on-reservation schools ranked highest and federal off-reservation
schools lowest by small margins on two-year analyses, and public
schools ranked slightly higher than federal schools on three-year
analyses. However, rankings of school types were so mixed on those
categories for which significant differences were found that differences
in ranks were not significant for one-year, two-year, or three-year
analyses. No significant differences in achievement between the
four types of schools were found for the four-year period.
Altogether, the four types of schools were compared on 104 measures
of academic achievement. Of this total of 104 categories of measure,
differences in achievement between school types were found to be
significant at the .05 level of confidence for only 45 categories.
The rankings of the four school types on the 45 significant categories
are shown in Table 8, which is a composite of Tables 3, 5, and
7.
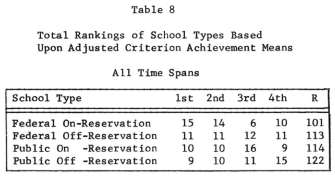
Applying the Friedman Test to the data in Table 8 yields an X2 of 3. With 44 degrees of freedom this falls far short of the X2 of 60+ necessary for significance at the .05 level.
In summary, significant differences in achievement between types
of schools were found for less than one-half of the categories
measured and no significant hierarchal pattern of achievement emerged
for those categories where significant differences in achievement
did exist. The evidence, therefore, does not indicate that the
academic achievement of American Indian students was superior or
inferior in any particular type of high school when individual
differences in scholastic aptitude and academic ability were controlled.
IV. ACADEMIC ACHIEVEMENT BY AREAS
Analyses of academic achievement by geographic areas also were
made, similar to the analyses of achievement completed for school
types. One-year, two-year, three-year, and four-year analyses
were made.
Designated areas correspond to Bureau of Indian Affairs administrative
areas and include the following: Aberdeen, Muskogee, Navajo, Phoenix,
and Juneau. The numbers of students drawn from each area were based
upon the numbers of students from the area enrolled in BIA schools.
Therefore, as might be expected, numbers of subjects varied greatly
for the different areas.
In testing differences in achievement between areas by analysis
of covariance, post-test achievement scores were used as the criterion
and pretest achievement and intelligence scores were used as control
variables, just as they were in analyzing achievement by school
types.
One-Year Analyses
Achievement by areas was analyzed for the following one-year periods:
Fall 1966 (pretest) - Spring 1967 (post-test)
Fall 1967 (pretest) - Spring 1968 (post-test)
Spring 1968 (pretest) - Spring 1969 (post-test)
Spring 1969 (pretest) - Spring 1970 (post-test)
Table 9 presents the means of criterion and control variables,
analysis of covariance, and adjusted criterion means, by areas,
for ninth grade students who were pretested in the fall of 1966
and post-tested in the spring of 1967. The remaining data for one-year
analyses of academic achievement by areas are presented in Tables
B1 - B12 in Appendix B.


A compilation of the adjusted criterion means gathered from Table
9 and Tables B1 - B12 is presented in Table 10. Rankings by areas
are indicated in parentheses, and categories for which significant
differences in achievement were not found are marked with the letter
x.
A study of Table 10 reveals that achievement differences between
the five areas were found to be significant for 31 of the 52 categories.
Based upon the adjusted criterion mean scores for the 31 categories
for which significant differences were found, the Juneau area ranked
first in 24 of 31 categories. A summary of the rankings from Table
10 is presented in Table 11. On the basis of sums of ranks (?R),
the Juneau area ranked highest by a wide margin (42), Aberdeen
ranked second (85), followed in order by Phoenix (102), Navajo
(117), and Muskogee (119).


Using the Friedman Formula to test differences in ranks for significance
yields an X2 value of 50.42. With 30 degrees of freedom, 50.42
is significant at the .05 level, indicating that achievement differed
significantly between areas on one-year analyses.
Two-Year Analyses
Achievement by areas was analyzed for the following two-year periods:
Fall 1966 (pretest) - Spring 1968 (post-test)
Fall 1967 (pretest) - Spring 1969 (post-test)
Spring 1968 (pretest) - Spring 1970 (post-test)
Tables B13 - B20 in Appendix B present the means of criterion and
control variables, analysis of covariance, and, where appropriate,
adjusted criterion means, by areas, for each of the two-year measurement
periods.
A summary of adjusted criterion achievement means by areas for
two-year intervals is presented in Table 12. An inspection of the
table reveals that differences in achievement between areas were
found to be significant for 25 of the 32 categories, while for
only 7 categories were differences found non-significant. Again,
as was true for the one-year analyses, the Juneau area ranked first
by a large margin, followed by Aberdeen. Next in order were Navajo,
Phoenix, and Muskogee.
A summary of the rankings from Table 12 appears in Table 13. On
the basis of sums of ranks (∑R), the Juneau area ranked highest
(40), Aberdeen and Navajo were second (75 and 76), followed by
Phoenix (86) and Muskogee (98).

Application of the Friedman Test
for differences in ranks yields an X2 value of 30.01, which is
not significant at the .05 level with 24 degrees of freedom.
Thus, analyses indicate that achievement did not differ significantly
between areas for the two-year measurement periods.
Three-Year and Four-Year Analyses
Analysis of achievement by areas was also analyzed for the following
three-year and four-year spans of time:
Fall 1966 (pretest) - Spring 1969 (post-test)
Fall 1967 (pretest) - Spring 1970 (post-test)
Fall 1966 (pretest) - Spring 1970 (post-test)
Tables B21 - B25 in Appendix B present the means of criterion and
control variables, analysis of covariance and, where appropriate,
adjusted criterion means, by areas, for each of the three-year
time spans and for the four-year period.
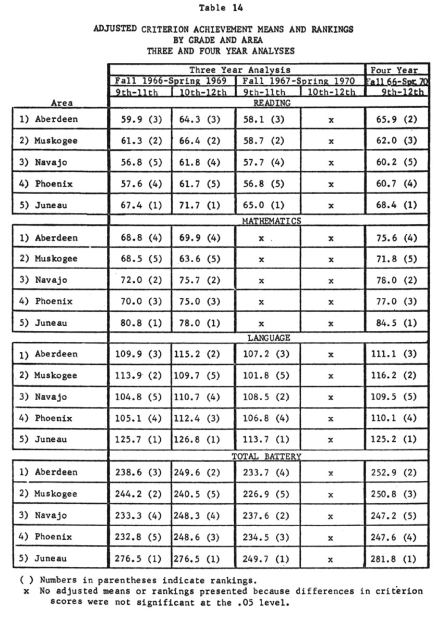
A summary of adjusted criterion means by areas for three-year and
four-year time spans are presented in Table 14. Differences in
achievement for the areas were significant for 11 of the 16 three-year
categories and for all 4 of the four-year categories. Juneau ranked
first in every three-year category, and was followed in order in
overall rankings by Aberdeen, Navajo, Muskogee, and Phoenix.
A summary of rankings from Table 14 for three-year analyses is
presented in Table 15. On the basis of sums of ranks the order
of rank from highest achievement to lowest is: Juneau, Aberdeen,
Navajo, Muskogee, and Phoenix.

The Friedman Test yields an X2 of 23.27, which is significant at
the .O1 level with 10 degrees of freedom, indicating that differences
in achievement between areas were significant for the three-year
measurement periods.
A summary of rankings from Table 14 for the four-year analyses
is shown in Table 16. On the basis of sums of ranks it can be seen
that achievement was highest in the Juneau area, followed in order
by Aberdeen, Muskogee, Phoenix, and Navajo.

Computation of X2 by the Friedman Formula gives a value of 10,
which is significant at the .05 level. Achievement of Indian
students in the five areas seemed to differ significantly over
the four-year measurement period.
Summary of Analyses of Academic Achievement by Areas
Based upon adjusted criterion means, the Juneau area ranked first
and the Aberdeen area second for every time span. Rankings for
the three other areas varied for the different measurement periods.
Of the total of 104 categories on which achievement was measured,
differences in achievement between areas were found to be significant
at or beyond the 5% level of confidence for 71, or more than two-thirds,
of the categories. Rankings based upon all 71 categories are presented
in Table 17, which is a composite of Tables 11, 13, 15, and 16.

Applying
the Friedman Test to the data in Table 17 yields an X2 of 107.14.
With 70 degrees of freedom this value is significant at the .O1
level of confidence.
In summary, when individual differences in scholastic aptitude
and academic ability were controlled, differences in achievement
between areas appeared to be significant, with the Juneau area
ranking highest, followed by Aberdeen. No clear pattern of superiority
emerged for the other three areas.
V. ACADEMIC ACHIEVEMENT BY GRADE AND SEX
Academic Achievement by Grades
Academic achievement data for each grade are presented in Table
18. While it is evident that academic achievement of Indian students,
as measured by the California Achievement Test, is progressive
from grade 9 through grade 12, it is also evident that achievement
is regressive when compared to national norms. For example, the
difference in grade placement in reading for students at the actual
9.1 grade level and those at the 12.8 grade level was 2 grades
rather than the 3.7 grades considered normal. For mathematics the
grade placement differences were even smaller, registering 1.3
grades for the 1966-67 school year and 1.9 grades for the 1967-68
school year. Language showed somewhat greater differences, with
2.5 grades for 1966-67 and 2 grades for 1967-68. In comparing actual
grade placement with achievement grade placement as measured by
the California Achievement Total Battery mean scores, it is seen
that Indian students were about one year retarded academically
when entering ninth grade but were more than two and one-half years
retarded when about to graduate from high school.
Percentile rankings demonstrate this progressive retardation very
strikingly. Based upon total battery mean scores, ninth grade students
ranked at percentile 27, while twelfth grade students ranked at
percentile 14. Similar regression occurred for each of the separate
subject areas. Scores were consistently highest in language and
lowest in mathematics.


Academic Achievement by Sex
When achievement scores are compared by sex, it can be seen from
an inspection of Table 19 that boys consistently scored slightly
higher than girls in reading and considerably higher than girls
in mathematics, while girls consistently scored substantially higher
than boys in language. Attesting to the consistency of the above
achievement pattern is the fact that the only exception to the
pattern in the 63 comparisons presented in Table 19 was for 12th
grade reading in the spring of 1969 testing.
The evidence clearly indicates superiority of Indian boys over
girls in the mastery of reading and mathematics skills and the
superiority of girls over boys in the mastery of English language
skills.
VI. RESPONSES TO OTHER MEASUREMENT INSTRUMENTS
Responses to Questionnaire
Each student was asked to respond to a questionnaire as a means
of obtaining personal and familial data. Total affirmative responses
to each question are presented in percentage form for each school
type in Table 20, and for each area in Table 21.
Student responses to the questionnaire, as presented in Table 20,
indicate that higher percentages of public high school than federal
high school students have telephones, TV sets, and daily newspapers
in the home. Also, more started school at six years of age or younger,
more of their parents are high school graduates, more of their
parents are regularly employed, and fewer students know how to
take part in tribal ceremonies.
Public off-reservation schools had the highest percentage in whose
homes English is the primary language, as well as the highest percentage
who spoke English when they started school. Public on-reservation
schools had the highest percentage of students residing on a reservation.
When questionnaire responses are tabulated by areas, as presented
in Table 21, certain differences and similarities between areas
become evident. Some of these that seem most apparent are:
1. A majority of Indian high school students in the Aberdeen (75%),
Navajo (80%), and Phoenix (90%) areas live on reservations, while
very few in the Muskogee (5%) and Juneau (5%) areas do.
2. Only 1°/ of the students tested in the Juneau area
claimed to have a TV set at home, while substantial numbers
in other areas,
ranging from 48 percent in the Navajo to 87 percent in the
Muskogee areas, claimed them.
3. The Juneau and Navajo areas ranked lower than other areas in
telephones, daily newspapers, parents who graduated from high school,
parents divorced or separated, and families receiving welfare assistance.
4. The Navajo area has much the lowest percentage of homes in which
English was the primary language (16%), and in percentage of students
who spoke English when they started school (56%), while Aberdeen
was highest in both categories (66%, 92%).
5. The Navajo area had the highest percentage who had dropped out
of school for 1/2 year or more (15%), and the Muskogee area the
lowest (4%).
6. The Navajo area ranked highest in percent of full-blood Indian
students with 91 percent, followed closely by the Phoenix area
at 86 percent.


7. The Muskogee area had the lowest percentage of fathers regularly
employed (37%) and Phoenix the highest (54%), while the Juneau
area had the lowest percentage of employed mothers (8%) and the
Aberdeen area the highest (27%).
8. Knowledge of how to take part in tribal ceremonies seems to
differ little from one area to another, ranging only from a low
of 31 percent in the Juneau area to a high of 38 percent in the
Aberdeen area.
Questionnaire responses by grade were also tabulated but are not
presented because of the similarity of responses from grade to
grade. For the same reason, it did not seem profitable to present
responses by sex.
Responses to Mooney Problem Check List
Tables 22-25 present responses of students to the abbreviated version
of the Mooney Problem Check List administered in this study. Students
were asked to check each item that they felt described a problem
for them. Figures in the tables are percentages of all students
in each category who checked the particular item.
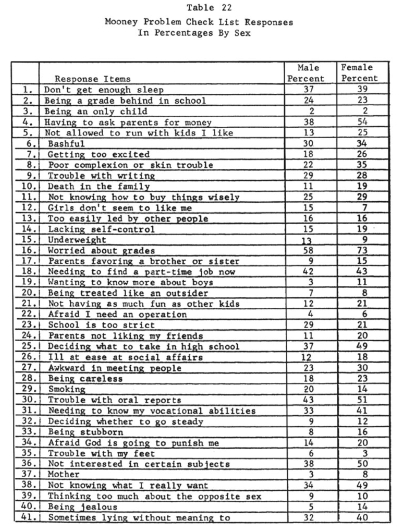

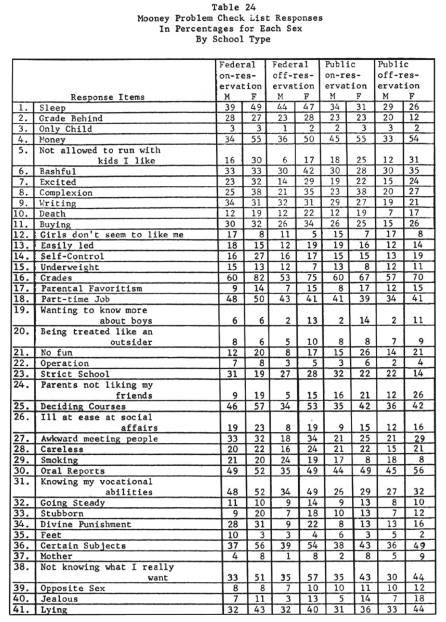

Table 22 reveals that more Indian high school students-of both
sexes were concerned about grades than about any other problem
listed. This item, number 16, was checked most frequently, both
by boys (58%) and by girls (73%). It is interesting to note that
the sexes agreed on the ten problems that troubled them most, although
not always in the same order of rank. The other items ranking in
the toy ten, in order of total frequency checked, are: (30) oral
reports, (4) having to ask parents for money, (36) not interested
in certain subjects, (25) deciding what to take in high school,
(18) needing to find a part time job now, (38) not knowing what
I really want, (1) not getting enough sleep, (31) needing to know
my vocational abilities, and (41) lying without meaning to.
Other items which ranked high in frequency of responses for both
sexes were: (6) bashful, (9) trouble with writing, (11) not knowing
how to buy things wisely, and (27) awkward in meeting people.
Girls also checked frequently: (8) poor complexion or skin trouble,
and (7) getting too excited. Apparently girls felt that they had
more problems than did boys, since 32 of the 41 items were checked
by a higher percentage of girls than boys. However, the following
problems seemed to concern more boys than girls: (23) school too
strict, (29) smoking, (12) girls don't seem to like me, and (15)
underweight.
Those problems checked least frequently were: (3) being an only
child, (35) trouble with my feet, (22) afraid I may need an operation,
(37) Mother, (19) wanting to know more about boys, and (2) being
treated like an outsider.
The following are some observations based upon inspection of Table
23:
1. In the Juneau area, parents not liking students' friends (24),
and not being allowed to run with certain friends (5) are not as
frequent problems as for students of other areas.
2. A higher percentage of Juneau area students found smoking (29)
and needing to know their vocational abilities (31) to be causes
for concern than did students of other areas.
3. Higher percentages of students in the Navajo area, with Phoenix
running a close second, checked the following items: (2) being
a grade behind in school, (7) getting too excited, (25) deciding
what to take in high school, and (34) afraid God is going to punish
me.
In making comparisons of Mooney data between school types it can
be seen in Table 24 that higher percentages of students in federal
schools than in public schools considered the following items to
be problems: (1) don't get enough sleep, (2) being a grade behind
in school, (9) trouble with writing, (25) deciding what to take
in high school, (29) smoking, (32) needing to know my vocational
abilities, and (38) not knowing what I really want. It is interesting
that students in federal on-reservation schools checked about twice
as frequently as other students item 34, "afraid that God
is going to punish me." They also checked item 22 more frequently, "afraid
I may need an operation."
Public school off-reservation students checked less frequently
than others item 23, "school is too strict."
In examining Mooney data by grades there are a number of problems
that seem to become increasingly critical as students progress
from grade 9 through grade 12. As can be seen from inspection of
Table 25 these problems are: (1) don't get enough sleep, (11) not
knowing how to buy things wisely, (18) needing to find a part-time
job now, (26) ill at ease at social affairs, (27) awkward in meeting
people, (31) needing to know my vocational abilities, and (38)
not knowing what I really want. Other problems seem to remain at
a relatively consistent level, with one rather interesting and
striking exception being the relatively high percentage of twelfth
grade males who considered item 23, "school is too strict," a
problem.
It is possible to analyze the Mooney Problem Check List responses
by problem areas, as well as by individual responses. Items may
be grouped together into seven problem areas. When total responses
made to all items in a problem area are figured as percentages
of total possible responses for all items in that problem area
and this is done for each of the seven areas, it is possible to
see the areas of greatest concern. The general problem areas, with
percentages of items that were checked for each problem area, are
as follows:
| I. |
Health and Physical Development (1, 8, 15, 22, 29, 35) |
17.3% |
| II. |
School (2, 9, 16, 23, 30, 36) |
38.3% |
| III. |
Home and Family (3, 10, 17, 24, 37) |
8.8% |
| IV. |
Money, Work, the Future (4, 11, 18, 25, 31, 38) |
39.8% |
| V. |
Boy and Girl Relations (5, 12, 19, 26, 32, 39) |
12.1% |
| VI. |
Relations to People in General (6, 13, 20, 27, 33, 40) |
18.5% |
| VII. |
Self-Centered Concerns (7, 14, 21, 28, 34, 41) |
21.7%
|
Problems of greatest concern to Indian high school youth appear to be in areas
IV and II, having to do with money, work, the future, and school. Next appear
to be those concerning self (VII) and relations to people (VI). Of least concern
seem to be problems of home and family.
The Semantic Differential
A Semantic Differential was administered in the fall of 1967. In this instrument
students were asked to react to ten concepts: SCHOOL, TEACHERS, MY SUCCESS
IN SCHOOL, MYSELF AS A PERSON, INDIAN, WHITE MAN, MY PRESENT LIFE, MY FUTURE,
EDUCATION, COLLEGE. Under each concept, twelve bipolar seven-point scales,
using adjective pairs, were presented, three for each of four major factors.
The four major factors and their opposite adjective pairs were as follows:
Evaluation (cognitive)?good-bad, valuable-worthless, important-unimportant;
Evaluation (affective)?pleasant-unpleasant, ugly-beautiful, nice-awful; Potency?weak-strong,
shallow-deep, influential-powerless; Activity?fast-slow, busy-idle, active-passive.
The following is the general format used:
SCHOOL
1. Good ==== ==== ==== ==== ==== ==== ==== Bad
2. Weak ==== ==== ==== ==== ==== ==== ==== Strong
etc.
Each scale was scored as follows:
|
|
7
|
6
|
5
|
4
|
3
|
2
|
1
|
Unpleasant
|
|
|
===
|
===
|
===
|
===
|
===
|
===
|
===
|
|
A score of 1 on the above scale indicates a rating of very unpleasant, 2 -
quite unpleasant, 3 - slightly unpleasant, 4 - neutral, 5 - slightly pleasant,
6 - quite pleasant, 7 - very pleasant.
Table 26 presents mean scores of factors under each of the concepts for school
types and also for each grade. The score for each factor was derived by averaging
the mean scores of the factor's three scales.

Comparing Semantic Differential Scores by Concepts
A comparison of total sample mean scores for the various concepts
in Table 26 reveals that Indian high school students have a high
regard for education. EDUCATION was given the highest overall rating
of the ten concepts with highest mean scores on both of the Evaluation
factors and second highest on the Potency and Activity factors.
COLLEGE was rated second highest overall, with the third highest
score on Cognitive Evaluation, second highest on Affective Evaluation,
and top scores on Potency and Activity. SCHOOL was rated second
highest on the Cognitive Evaluation factor, but only sixth on Affective
Evaluation. Apparently, school was liked less than it was valued.
Overall rankings of the ten concepts, from highest to lowest, with
ratings on each factor shown in parentheses, were as follows:
EDUCATION (1,1,2,2); COLLEGE (3,2,1,1); MY FUTURE (4,3,3,3);
INDIAN
(5,4,5,4); SCHOOL (2,6,4,7); MY PRESENT LIFE (8,5,7,5);
TEACHERS (7,8,6,6); MY SUCCESS IN SCHOOL (6,7,8,8);
MYSELF (9,9,9,9); WHITE MAN (10,10,10,10).
As can be seen, there was great consistency in factor ratings.
When subjected to Friedman's rank order of analysis test it was
found that differences between concept ratings were significant
at the .O1 level of confidence.
Apparently, Indian students were quite optimistic about their future,
since they rated the concept MY FUTURE third highest. However,
a comparatively low self-concept is indicated by the next to last
rating of MYSELF AS A PERSON on all four factors. The concept WHITE
MAN scored lowest on every factor.
Comparing Semantic Differential Scores By School Types
Differences between ratings assigned to the concepts by the four
school types proved to be significant beyond the .05 level of confidence
for only three of the ten concepts -- INDIAN, WHITE MAN, and MY
FUTURE.
Federal off-reservation school students gave INDIAN a higher rating
on every factor than did students of the other types of schools.
Federal on-reservation school students rated INDIAN next highest,
public-off reservation students next, and public on-reservation
students rated INDIAN lowest on every factor. With only one exception,
federal schools in the study are segregated, while all public schools
are integrated. Apparently, Indian students attending all-Indian
schools hold a higher opinion of Indians than do those in integrated
school situations.
Public on-reservation school students rated WHITE MAN higher than
did other students on every factor, federal on-reservation students
rated WHITE MAN next highest overall, federal off-reservation next
to lowest overall, and public off-reservation students lowest on
every factor. Those students attending school on reservations in
an Indian dominated society tended to rate WHITE MAN higher than
did those attending school off-reservation in the white man's world.
On the concept MY FUTURE, federal off-reservation school students
scored highest overall, followed in order by public off-reservation,
public on-reservation and federal on-reservation. Apparently, off-reservation
Indian students are more optimistic about the future than are on-reservation
students.
Comparing Semantic Differential Scores By Grades
Based upon scores on all factors, differences between the ratings
of ninth, tenth, eleventh, and twelfth grade students were significant
for three of the ten concepts--WHITE MAN, MY PRESENT LIFE, and
EDUCATION. For each of the three concepts, ratings tended to
be higher for
each successively higher grade.
When the Cognitive Evaluation factor scores are examined by themselves,
the pattern of progressively higher scores for each successive
grade is noticeable for all concepts except MYSELF AS A PERSON,
INDIAN, and COLLEGE. However, scores on Affective Evaluation do
not show the same increase. As Indian students progress through
high school it appears that they place an increasing value on school,
teachers, education, their success in school, their present life,
their future, and white people, but experience no increased positive
feeling toward them.
Scores on Potency and Activity factors vary only little by grades
for most concepts. Exceptions are increases in Activity ratings
for WHITE MAN, and in Potency ratings for WHITE MAN, EDUCATION,
and COLLEGE.
Comparing Semantic Differential Scores By Areas
Semantic Differential scores are presented by areas in Table 27.
Ratings by the Indian students in the five geographic areas differed
significantly on every concept except SCHOOL. The following are
some observations on the ratings:

1. The Juneau area gave TEACHERS and WHITE MAN the highest ratings,
followed closely in each case by the Navajo area. The lowest ratings
were given these two concepts by the Muskogee area. The Aberdeen
area also rated WHITE MAN very low, with next to lowest scores
on all four factors.
2. The Muskogee area rated INDIAN highest and the Juneau area rated
INDIAN lowest.
3. Muskogee area students seemed to evidence greater self-esteem
and confidence than students in other areas by registering the
highest scores on all factors for MY SUCCESS IN SCHOOL, MYSELF
AS A PERSON, INDIAN, and MY FUTURE. The Muskogee area also scored
highest on three factors and second on the fourth factor for the
concept MY PRESENT LIFE.
4. The Aberdeen area scored high on MYSELF AS A PERSON, MY PRESENT
LIFE, and MY FUTURE, ranking second to Muskogee on each concept.
5. The Phoenix area rated the following concepts lower than did
the other areas: MY SUCCESS IN SCHOOL, MY PRESENT LIFE, MY FUTURE,
EDUCATION, and COLLEGE.
6. The Navajo and Juneau areas rated EDUCATION higher than did
the other three areas.
7. COLLEGE was rated highest by the Muskogee area.
Comparing Semantic Differential Scores By Sexes
It is evident in Table 27 that females generally rated the concepts
higher than did males. Girls rated TEACHERS, WHITE MAN, EDUCATION,
and COLLEGE higher on every factor, and SCHOOL and MY FUTURE higher
on three of the four factors. Exceptions to the general trend appear
for the concepts MY SUCCESS IN SCHOOL and MYSELF AS A PERSON, which
were rated higher by boys than by girls on all four factors, and
MY PRESENT LIFE, which was rated higher by boys on three factors.
Indian boys seem to have a better self-concept and greater confidence
in themselves than do girls, but may have less optimism about the
future.
Responses to School Interest Inventory
In the spring of 1968 the School Interest Inventory was administered
to 2164 Indian high school students. On this instrument each student
was asked to respond to 150 statements by marking them true or
false. Table 28 presents percentages of true and false responses
to certain items that have been selected for presentation because
of their information value. Some of the items presented in Table
28, like numbers 31 and 73, are not used in scoring the tests but
do provide valuable personal and familial data. Other items, like
numbers 8 and 93, are meaningful for individuals but not for group
analysis, and are omitted. Item numbers in Table 28 correspond
to item numbers in the instrument. It will be noted that the percentages
do not always add to 100 percent, because some items received no
response from a small percentage of students.


Comparing School Interest Inventory Scores by School
Types and Areas
The School Interest Inventory can be scored to obtain either weighted
or unweighted totals. The weighted method, which assigns values
of 1 to 9 for each item, is used in this study. Boys and girls
are scored on different scales and, therefore, their scores are
not comparable. The scale for boys contains 90 items and has a
potential total score of 375, while the scale for girls has 86
items and a potential score of 337. There are 72 items common to
both scales. Some items in the Inventory are not used for scoring
on either scale.
As in golf and cross-country, the lower score is the better score.
High scores on the School Interest Inventory indicate lack of interest
in school and high probability of dropout. In this study, mean
weighted scores are used to compare the interest in school of Indian
students in different types of schools and in different geographic
areas. These scores are presented in Table 29. Since scores registered
by boys and girls are not comparable they are presented separately.

Inspection of Table 29 reveals that the mean scores for males differ
considerably for the four school types and also for the five areas,
while female scores for areas differ somewhat less than do male
scores, and differ even less for school types. To test the differences
for significance, analysis of variance was used. The results are
presented in Table 30.

Interest in school, as measured by the School Interest Inventory,
differed significantly for boys in the four types of school, with
those in public on-reservation schools registering the greatest
interest and those in federal on-reservation schools the least.
Differences were also significant for boys in the five geographic
areas, with those in the Aberdeen area registering the greatest
interest in school and those in the Navajo area the least.
Differences for girls by school types were not significant. However,
differences for girls by areas were significant, with those in
the Juneau area registering the greatest interest and those in
the Phoenix area the least.
When male and female scores are considered together and a combined
ranking is determined for school types, the order from greatest
interest to least interest is as follows: public on-reservation,
public off-reservation, federal off-reservation, federal on-reservation.
Similarly, the order for areas is as follows: Juneau, Aberdeen,
Phoenix, Navajo, Muskogee. It is interesting that the order of
rank of areas on the School Interest Inventory is identical to
the academic achievement ranking appearing in Table 17.
There are no tables of normative data for the School Interest Inventory.
However, some comparison can be made of mean scores for Indian
students in this study with mean scores for non-Indian students
in other studies. A study in one high school found that the mean
weighted score for male students who stayed in school was 51.98,
while the mean weighted score for male students who later dropped
out was 116.52. For females the scores were 56.91 for stay-ins
and 103.77 for dropouts. A study of students in four other schools
found mean scores of 72.69 for male stay-ins, 137.20 for male dropouts,
60.49 for female stay-ins, and 110.02 for female dropouts.1
It is evident from the above figures that mean scores for Indian
students tend to run high, almost approaching dropout levels. This,
of course, is consistent with the high dropout rates for Indian
students, which have been found to be 39 percent in the Southwest2
and 48 percent in the Northwest3 from enrollment in grade eight
to graduation from high school.
The School Interest Inventory has proved to be a useful instrument
for identifying potential school dropouts. However, its value with
American Indian students was not known. In the interests of investigating
the predictive value of the SII for Indians some further analyses
were attempted on a small scale.
Since the SII was administered in the spring of 1968, those students
who were enrolled in grade nine at that time normally would have
graduated in the spring of 1971. Computer printouts of names of
ninth grade students who had taken the SII in 1968 were mailed
to selected schools with the request that the students listed be
identified as graduates, dropouts, or transfers. Unfortunately,
some school officials were unable to classify a majority of those
who had withdrawn as either definite dropouts or transfers, and
a fourth classification of "unknown" was added. Furthermore,
as no attempt was made to follow-up those who were identified as
transfers, it was not possible to determine whether they were eventually
dropouts or graduates.
Responses were received from four BIA schools and six public schools
as widely scattered in location as Alaska, Arizona, Utah, New Mexico,
Oklahoma, Nebraska, and South Dakota. Table 31 shows the number
of students in each classification and the average weighted score
registered on the SII by the students so classified.

It is evident from the average scores in Table 31 that the SII
does discriminate to some degree between Indian graduates and dropouts.
However, an examination of single scores leads one to the conclusion
that identification of dropouts on an individual basis would be
difficult.
An inspection of test items reveals some that seem inappropriate
for Indians. An item analysis was made of the responses of the
graduates and dropouts to determine which items seem to discriminate
and which do not. Some items that discriminate between graduates
and dropouts for the general school population but do not for Indian
students are the following:
4. I have more than one older brother or sister.
16. To get a job like my fathers I will have to finish high school.
30. My parents are active in community affairs.
33. My mother does a lot of church work.
47. I like love scenes on television.
50. My mother did not complete eighth grade.
63. My father did not complete high school.
76. My mother completed high school.
84. My father works with his hands.
94. Counting my parents and me, there are more than five people
in my family.
141. I have more friends of the opposite sex than of my own sex.
145. My father did not complete eighth grade.
Other discrepancies appeared in responses by boys to questions
about clothes and by girls to questions about age. Items 25 and
132, "I would be happier in school if I could buy better clothes;" and "Most
of the people in my homeroom have better clothes than I do;" did
not discriminate for Indian boys, although they did for girls.
Also, items 88, 93 and 138, "I am one of the oldest in my
homeroom;" "Most of my friends are older than I;" and "I
am older than most of the people in my class;" did not discriminate
for Indian girls, although they did for boys.
Among the items that seem to discriminate for Indian students but
do not for others are the following:
6. It would be more fun to go to an art gallery than to a showing
of new cars (Indian graduates tended to answer this "true",
and dropouts to answer it "false."
31. My father earned more than $3000 last year.
52. I am not at ease with others.
140. My mother encourages me to do well in school.
It appears that the School Interest inventory could be a useful instrument
for identifying high dropout risks among Indian students if some modifications
were made in scoring based on the item analysis of responses of dropouts and
graduates.
The California Psychological Inventory and the Value Orientation Scale
Five measures from the California Psychological Inventory (CPI) were used:
CS (Capacity for Status), SP (Social Presence), AC (Achievement via Conformance),
SA (Self-Acceptance), and AI (Achievement via Independence). According to the
test manual these measures were designed to assess characteristics of personality
as described below.
CS To serve as an index of an individual's capacity for status (not his actual
or achieved status). The scale attempts to measure the personal qualities that
underlie and lead to status.
SP To assess factors such as poise, spontaneity, and self-confidence in personal
and social interaction.
AC To identify those factors of interest and motivation that facilitate achievement
in any setting where conformance is a positive behavior.
SA To assess factors such as personal worth, self-acceptance, and capacity
for independent thinking.
AI To identify those factors of interest and motivation that facilitates achievement
in any setting where autonomy and independence are positive behaviors.4
Also, a value scale,5 developed by Strodtbeck, was used as a measure of acculturation
to middle class values. This Value Orientation Scale consisted of eight true
and false questions as follows:
-
Planning only makes a person unhappy since your plans hardly ever work
out anyway.
- When a man is born, the success he's going to have is already
in the cards, so he might as well accept it and not fight against
it.
- Nowadays, with world conditions the way they are, the wise person
lives for today and lets tomorrow take care of itself.
- Even when teenagers
get married, their main loyalty still belongs to their fathers and mothers.
-
When the time comes for a boy to take a job, he should stay near his
parents, even if it means giving up a good job opportunity.
- Nothing in
life is worth the sacrifice of moving away from your parents.
- The
best kind of a job to have is one where you are part of an organization,
all working together, even if you don't get individual credit.
- It's silly
for a teenager to put money into a car when money could be used to get
started in business or for an education.
The first three questions have to do with time orientation and mastery over
one's destiny. Questions 4-6 measure familism versus individualism, and loyalty
to extended family versus loyalty to nuclear family. Question 7 tests for group
versus individual orientation. Question 8 deals with immediate versus postponed
gratification.
It was hypothesized that those holding values of the dominant culture would
tend to answer the first seven questions, "false," and the last question, "true," while
those more oriented toward traditional Indian values would tend to answer the
questions in the opposite way. In using the Value Orientation Scale as a measure
of orientation to values of the dominant culture, scores were computed by totaling
the number of "middle class" answers. Thus, a higher score indicated
a greater degree of orientation to middle class values.
Table 32 presents mean scores, by types of school and by sex, for each of the
five scales of the CPI that were used, and for the Value Orientation Scale.
Differences in means were tested for significance by analysis of variance.

Differences
between scores for school types were not significant, either for males or
females, on CAPACITY FOR STATUS, or on ACHIEVEMENT VIA CONFORMANCE. Significant
differences
were found, for both males and females, on SOCIAL PRESENCE and on ACHIEVEMENT
VIA INDEPENDENCE, for females on SELF-ACCEPTANCE, and for females on VALUE
ORIENTATION.
Public off-reservation students scored highest on SOCIAL PRESENCE, while federal
on-reservation students scored lowest.
Public off-reservation and federal on-reservation students scored highest on
ACHIEVEMENT VIA INDEPENDENCE, public on-reservation students ranked next, and
federal off-reservation students ranked lowest.
On SELF-ACCEPTANCE, female students in public off-reservation schools scored
highest, public on-reservation next, then federal off-reservation, and federal
on-reservation lowest. While differences in scores for males were not significant,
it is interesting to note that they follow the same pattern.
Females in public off-reservation schools indicated a higher degree of acculturation
than those in other types of schools by scoring highest on VALUE ORIENTATION,
while those in federal on-reservation schools scored lowest. Differences were
not significant for males.
Differences between scores for areas were significant in most instances, as
can be seen in Table 33.
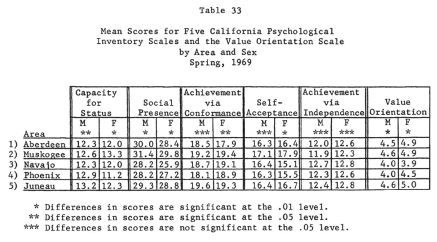
When area scores in Table 33 are examined and compared,
the following facts become apparent:
-
Juneau males and Muskogee females scored higher than their counterparts
from other areas on CAPACITY FOR STATUS.
- Muskogee students, both male
and female, scored substantially higher than students from other areas
on SOCIAL PRESENCE. Next highest were Aberdeen and Juneau, followed by
Phoenix and Navajo.
- Muskogee and Juneau students ranked highest on ACHIEVEMENT
VIA CONFORMANCE.
- Muskogee area female students ranked highest on SELF-ACCEPTANCE,
followed by Juneau, Aberdeen, Phoenix, and Navajo. Muskogee and Juneau
male students also ranked highest, although differences were not significant.
-
Differences in scores for ACHIEVEMENT VIA INDEPENDENCE were not significant,
either for males or females. However, it is interesting that both male and
female students in the Navajo area scored highest on this factor.
- The orders
of rank on VALUE ORIENTATION are very similar for males and females.
Considering the scores of boys and girls together on this measure of acculturation,
Juneau students rank highest, followed by Muskogee, Aberdeen, Phoenix, and
Navajo.
An examination of Table 34 reveals that scores tend to increase for each successive
grade, with twelfth grade students scoring higher than tenth in every instance,
and higher than eleventh with only one exception. Differences in scores between
grades were significant in six of the twelve cases. Attention is directed to
gains on SOCIAL PRESENCE and VALUE ORIENTATION from grade ten to grade twelve.
Apparently the school has a strong socializing and acculturating effect upon
students.
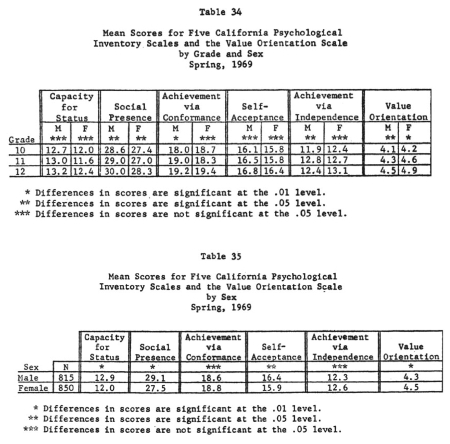
Males scored higher than females on all scales for which differences
in scores were significant, except on VALUE ORIENTATION. The scores indicate
that boys in the sample are more ambitious and self-seeking, feel more self-confident
in social interaction, and have a greater sense of personal worth than girls,
but that girls are more oriented to the values of the dominant culture.
The Vocational Aspiration Scale
A vocational aspiration scale was devised to measure the differential between
level of occupational desire and level of occupational expectation of Indian
high school students. The instrument was administered in the spring of 1970
to 1,286 students in grades eleven and twelve.
In constructing the instrument, 110 occupations were selected for each sex
and listed in order of general standing as determined by reference to rankings
appearing in various studies. Eleven groups of occupations were then formed
from the list, each group containing one occupation from the ten highest occupations
listed, one from the next ten highest on the list, and so on down to one from
the lowest ten on the list. In each of the eleven groups, then, ten occupations
were listed, each one representing a different level of occupational standing
from high to low.
Each group of ten occupations was presented to the examinee at three different
points in the instrument. At one point the examinee was asked to rate the occupations
from one to ten on the basis of general standing, at another point to indicate
which job in the group he would choose to have in the future if free to have
any one he wished, and at still another point to check the job which he feels
is the best one he is really sure that he can get in the future.
Table 36 presents the eleven occupation groupings appearing in the Vocational
Aspiration Scale for Males and the order of rank in each group as determined
by the mean ratings of the 635 male respondents. Table 37 presents the same
information for the 651 female respondents.


Inspection of Tables 36 and 37 reveals a number of ratings that
would seem to suggest either a lack of information about occupations
or possibly some cultural bias. For example, boys rated computer
programmer higher than sociologist or psychologist, electric
or telephone lineman higher than veterinarian, factory machine
operator and carpenter higher than newspaper editor, auto or
airplane mechanic higher than certified public accountant, heavy
machine operator higher than actor, oilfield roughneck and mail
carrier higher than undertaker, electrician higher than clergyman,
and welder higher than TV announcer. Girls rated medical technician
higher than physician or sociologist, physical therapist higher
than lawyer, practical nurse higher than biologist, file clerk
higher than radio announcer, computer programmer higher than
architect, stenographer higher than dietician or TV announcer,
bank teller higher than newspaper editor, office clerk higher
than veterinarian or draftsman, airline stewardess higher than
speech therapist, and teacher aide higher than postmistress.
In general, the Indian high school students rated the occupations
of lower standing quite accurately but did not display the same
judgment in ranking the occupations considered to be of higher
standing. This may reflect the low socioeconomic backgrounds of
most of the students and their consequent lack of first hand acquaintance
with many of the higher prestige occupations.
In determining the differential between occupational desire and
occupational expectation for each examinee, the difference was
computed between the ranking of the preferred job in each group
and the best expected job in that group, using the examinee's own
job ratings. A total score for each subject was then computed by
subtracting the sum of the desired occupation scores from the sum
of the expected occupation scores. Scores ranged from +84 to -32.
If expectations were lower in rank than preferences, a positive
differential resulted. There were many cases of preference for
jobs having lower standings than the jobs the examinee thought
he could get, resulting in negative scores for about one-third
of the examinees. However the mean differential score for girls
was +7.6 and for boys was +9.4, indicating that, in general, vocational
expectations were somewhat lower than were aspirations, and that
boys, more than girls, felt that they would not be able to procure
jobs of as high ranking as they would like.
REFERENCES
1. Cottle, William C. Examiner's Manual for the School Interest
Inventory. Houghton Mifflin Company, Boston, 1966.
2. Owens, Charles S. and Willard P. Bass. The American Indian
High School Dropout in the Southwest. Southwestern Cooperative Educational
Laboratory, Albuquerque, 1969.
3. Selinger, Alphonse D. The American Indian High School Dropout.
Northwest Regional Educational Laboratory, Portland, Oregon, 1968.
4. Gough, Harrison G. California Psychological Inventory Manual.
Consulting Psychologists Press, Inc., Palo Alto, California, 1957.
5. Strodtbeck, Fred L. "Family Integration, Values, and Achievement," in
A. H. Halsey, et. al., Education, Economy, and Society. The Free
Press of Glencoe, Inc., New York, 1961.
VII. RELATIONSHIPS BETWEEN VARIABLES
Variables Measured
In order to explore the possible relationships between certain
variables measured by the various instruments administered during
the study, Pearson product moment coefficients of correlation were
computed. The following factors were used.
-
Academic Achievement, as measured by the total battery score
on the California Achievement Test (CAT).
- Mental Ability, as
measured by the California Test of Mental Maturity (CTMM).
-
Value Orientation, as measured by the Value Orientation Scale
(VOS).
- Self-Concept, as measured by the combined scores
of three California Psychological Inventory (CPI) scales--Capacity
for Status, Social Presence, and Self-Acceptance.
- Self-Concept,
as measured by responses on the Semantic Differential (SD)
to the concepts MY SUCCESS IN SCHOOL, MYSELF AS A PERSON,
INDIAN, MY PRESENT LIFE, and MY FUTURE.
- Acculturation, as
measured by 16 questions on the Questionnaire (Q).
- Acculturation,
as measured by 23 selected items from the School Interest
Inventory (SII).
- Achievement Motivation, as measured by the
Achievement Via Conformance (AC) scale of the California
Psychological Inventory (CPI).
- Achievement Motivation, as
measured by the Achievement Via Independence (AI) scale of
the California Psychological Inventory (CPI).
- Vocational
Aspiration-Expectation Differential, as measured by the Vocational
Aspiration Scale (VAS).
Pearson product moment coefficients of correlation were computed in one operation
between all of the above ten variables in order to provide a matrix as presented
in Table 38. This procedure limited the sample to 391 students for whom there
were data on every variable.

Correlations Between Achievement and Other Variables
As can be seen in Table 38, academic achievement proved to be correlated
significantly in the positive direction with six of the nine other
variables. The coefficient of .667 indicates, as expected, that
there is a strong positive correlation between mental ability and
academic achievement. Probably there are factors other than innate
mental ability that are being measured by the CTMM, such as reading
skill and ability to work quickly and accurately, but, in any event,
it is a strong predictor of academic success.
Of the remaining variables, value orientation has the highest correlation
with achievement, and self-concept, as measured by the CPI, also
appears to have definite relationship to achievement. These two
variables will be discussed at greater length later.
The moderate correlation of .294 between achievement and the vocational
aspiration-expectation differential indicates that there was some
tendency for better students to have greater differences between
occupational desires and actual expectations than did poorer students.
It will be noted that the coefficient of correlation between mental
ability and vocational aspiration-expectation differential is almost
identical to that between achievement and vocational aspiration-expectation.
Possibly the Indian high school juniors and seniors of lower mental
ability and academic standing are cognizant of their limitations
and, therefore, do not aspire as high vocationally as do the more
intelligent students of higher academic rank. Many capable Indian
students, aware of their potential, may desire high ranking occupations,
but, because of problems endemic to their minority group status
and, possibly, because of cultural influences that bear upon them,
they may be doubtful about ever making their aspirations an actuality.
Acculturation (Q) shows some positive correlation with achievement,
indicating a definite but moderate relationship between the two.
Apparently, degree of acculturation, as measured by the sum total
of such characteristics as living off of a reservation, speaking
English in the home, having a TV set, parents having a high school
education, etc., has a positive relation to achievement, but is
not a highly potent factor. The factor of home language was isolated
from other factors included in acculturation (Q) and its relationship
to achievement was investigated. Findings from this analysis are
presented later in this chapter.
Some positive correlation is indicated between mental ability and
value orientation. It would appear that to some degree students
of higher intelligence have internalized more of the values usually
associated with the dominant culture than have students of lower
intelligence.
A moderate and rather substantial positive correlation, as indicated
by the coefficient of .373, exists between mental ability and acculturation
(Q). The explanation may be that students from backgrounds indicative
of greater acculturation simply do better on standardized tests,
like the CTMM, than do students from less acculturated backgrounds
which are generally conceded to produce educational disadvantage.
The coefficient of correlation of .259 between acculturation (Q)
and vocation aspiration-expectation differential is indicative
of a small but significant and definite relationship. It appears
that the more acculturated students had greater differentials between
occupational desires and occupational expectations than did less
acculturated students. Perhaps students with a relatively high
degree of acculturation have had more of the experiences that tend
to raise occupational aspirations but are dubious of their chances
of realizing them, while those of a lesser level of acculturation
tend to expect and be satisfied with lower prestige occupations.
Other correlations showing significant relationships are interesting
but not very enlightening, except perhaps as suggestions for further
steps in analysis. For example, the correlation between acculturation
(Q) and acculturation (SII) is moderately high and might be combined
into one measure for further analyses. Substantial correlations
between achievement motivation (AC) and achievement motivation
(AI), and between self-concept (CPI) and achievement motivation
(AC) were not unexpected. However, the almost zero correlation
between self-concept (CPI) and self-concept (SD) was surprising,
as were the low correlations between value orientation and the
two acculturation variables.
Relationships of Value Orientation and Self-Concept to
Academic Achievement
The relationships between value orientation and academic achievement,
and between self-concept (CPI) and academic achievement were analyzed
further, using a sample of all students for whom data had been
gathered on all three variables. This raised the number of subjects
to 1,664. Pearson product moment coefficients of correlation were
computed, as presented in Table 39.

As can be seen in Table 39 there was a coefficient of correlation
of .359 between academic achievement and value orientation. This
is somewhat higher than the coefficient of .314 appearing in the
matrix constituting Table 78 that was computed on a smaller sample.
The coefficient of .359 indicates a moderately high positive relationship
between degree of orientation to values of the dominant culture
and level of academic achievement.
A significant relationship, but of lesser magnitude, also was evident
between self-concept (CPI) and achievement. The coefficient of
correlation again was higher for the larger sample than that shown
in Table 78. A coefficient of correlation of .264 suggests that
strong positive feelings about self on the part of Indian students
are reflected to a moderate degree in higher levels of achievement.
Academic Achievement and the Language of the Home
The relation between principal language of the home and academic
achievement was explored. This was done by comparing home language
of high achievers with home language of the entire sample.
An examination of individual achievement test scores registered
by students in the fall of 1966, and in the fall of 1967 by all
new students added to the sample at that time, revealed that only
349, or less than ten percent, scored at or above the 50th percentile.
It was found that 189, or 54 percent, of these 349 high achievers
came from homes in which English was spoken most of the time, while
160, or 46 percent, came from homes in which a native Indian language
was predominant. For the sample as a whole, 33 percent came from
English speaking homes and 67 percent from native speaking homes.
Thus, if the home language pattern were the same for the high achievers
as for the whole sample, it would be expected that only 33 percent
of the 349 high achievers, or 115 instead of 189, would be from
English speaking homes and 67 percent, or 234 instead of 160, would
be from native speaking homes.
To test for significance in difference of home language between
high achievers and the entire sample chi-square was employed. Actual
and expected frequencies for high achievers are shown in Table
40.

Computation of chi-square yields an X2 value of 63.307. This value
is much greater than the 6.635 necessary for significance at the
.O1 level of confidence, and, in fact, is far beyond the value
of 10.8 necessary for significance at the .001 level. Evidence
clearly indicates that a significantly greater number of students
from English speaking homes and fewer from native speaking homes
were high achievers than the numbers of each in the whole sample
would warrant. Apparently, there is a definite relationship between
the language of the home and academic achievement.
VIII. SUMMARY AND CONCLUSIONS
Academic Achievement by Types of Schools
The primary concern of the study was to determine whether there
were significant differences in academic achievement between Indian
students in four types of high schools--federal on-reservation,
federal off-reservation, public on-reservation, and public off-reservation.
Using pretest and post-test scores gathered over a span of four
years it was possible to assess achievement for four one-year periods,
three two-year periods, two three-year periods, and one four-year
period. When this was done by grades for each time period, using
the California Achievement Test scores for reading, mathematics,
language, and total battery, 104 categories of assessment resulted.
Controlling for initial individual differences in scholastic aptitude
and academic ability, treatment of the data by analysis of covariance
revealed that differences in achievement between the four school
types, significant at or beyond the .05 level of confidence, had
occurred for only 45 of 104, or less than one-half, of the categories.
Significantly, no reliable differences in achievement between the
four types of schools were found for the four-year period from
the fall of 1966 to the spring of 1970. For the 45 categories for
which significant achievement differences were registered, rankings
were so variable that no hierarchal pattern, or evidence of particular
superiority or inferiority, emerged.
In the light of the above findings it can confidently be concluded
that when initial individual differences in scholastic aptitude
and academic ability were controlled there was no evidence that
academic achievement of American Indian students was greater in
one type of school than in another.
Academic Achievement by Areas
Differences in academic achievement of Indian students in the Aberdeen,
Muskogee, Navajo, Phoenix, and Juneau areas were found to be significant
at or beyond the .05 level of confidence for 71, or more than two-thirds,
of the 104 categories of assessment.
Students in the Juneau area demonstrated a marked superiority in
achievement, ranking first by wide margins for one-year, two-year,
three-year, and four-year analyses. Aberdeen ranked second for
every time span. The other three areas varied in achievement rank
for the various categories to the extent that no pattern of overall
rank could be determined.
When initial individual differences in scholastic aptitude and
academic ability were controlled, the evidence clearly established
the academic superiority of the Juneau area, with Aberdeen a distant
second, and no clear pattern of rank evident for the other three
areas.
Academic Achievement by Grades
The data show that the academic achievement of Indian students
is progressive from grades 9-12 but regressive when compared to
national norms. Based upon California Achievement Total Battery
mean scores, Indian students were one year retarded academically
when entering ninth grade and more than two and one-half years
retarded when about to graduate. In terms of percentiles, they
ranked at the 27th percentile at the ninth grade level and at the
14th percentile at the twelfth grade level.
Scores were consistently highest in language and lowest in mathematics.
However, the greatest regression in comparison to national norms
occurred in reading. Ninth grade students ranked at the 34th percentile
in reading and twelfth grade students at the 12th percentile.
Academic Achievement by Sexes
There were 21 comparative scores for boys and girls on reading,
21 on mathematics, and 21 on language. Boys scored slightly higher
in 20 of the 21 reading cases. Boys scored higher than girls in
all 21 cases in mathematics. Girls, on the other hand, scored higher
than boys in every case in language.
The evidence clearly indicates a slight but reliable superiority
of Indian boys over girls in reading, and a considerable superiority
in mathematics. However, girls demonstrate a substantial superiority
over boys in the mastery of English language skills.
Responses to Other Measurement Instruments
Responses to a number of self-report instruments yielded a variety
of data that are the bases for certain conclusions.
A native language, rather than English, was the principal medium
of oral communication used in the homes of two-thirds of the students.
About 50% of the homes had television sets, but only 15% had telephones.
Only 50% of the students' fathers and about 20% of the mothers
were regularly employed. Less than 30% of the parents were high
school graduates and about 60% had completed eighth grade. Families
were comparatively large; three-fourths of the students' families
numbered five or more.
In general, Indian students appeared to value education highly,
like school, be greatly concerned about grades, have confidence
in their scholastic ability, and respect their teachers. But they
also indicated that school is skipped frequently and many gave
evidence of being high dropout risks.
Indian students expressed optimism about the future and indicated
that they have a healthy pride in racial and cultural heritage
by rating INDIAN high among ten concepts, and much higher than
WHITE MAN, on a semantic differential. The latter concept was given
the lowest rating and MYSELF AS A PERSON the next lowest rating.
However, since mean ratings of these two concepts were in the positive
range, highly unfavorable attitudes toward self and the white man
do not seem to be indicated.
Type and location of schools seemed to be factors related to certain
student attitudes. Indian students attending schools in off-reservation
settings registered greater optimism concerning their future than
did on-reservation students. Those in the most integrated situations
(public off-reservation schools) scored higher on measures of self-esteem
than did those in the most segregated situations (federal on-reservation
schools). Those in the segregated, federal schools indicated a
greater regard for the Indian than did those in the integrated,
public schools. Students attending schools located in the Indian-dominated
society of the reservation registered a higher opinion of the white
man than did those attending schools located in the off-reservation,
Anglo-dominated society.
Students in the Muskogee area had the highest opinion of the Indian
of any of the five areas and the lowest opinion of the white man,
while those in the Juneau area registered the highest opinion of
the white man and the lowest opinion of the Indian. Muskogee area
students scored highest on measures of self-esteem, but also registered
the lowest opinion of teachers and the least interest in school.
Juneau area students, on the other hand, evidenced the greatest
interest in school and the highest regard for teachers and education.
The students in the Phoenix area rated themselves lowest of the
five areas on measures of self-esteem and of attitudes toward their
present life, their future, their school success, education, and
college.
The data indicate that students in the Aberdeen, Juneau, and Muskogee
areas were more oriented to values of the dominant culture and
possessed greater social presence than those in the Navajo and
Phoenix areas. Also, students in public off-reservation schools
rated highest and those in federal on-reservation schools lowest
on value orientation and social presence. Significant gains on
social presence and value orientation for each successive grade
(10-12) suggest that the school has a socializing and acculturating
effect upon Indian students.
There was an evident lack of information among Indian high school
students about occupations, particularly about those in the higher
prestige range. Also, vocational expectations were lower than vocational
aspirations. Boys, more than girls, thought that they would be
unable to obtain jobs of as high ranking as they desired.
Relationships Between Variables
Pearson product moment coefficients of correlation showed that
mental ability, value orientation, self-concept as measured by
three scales of the California Psychological Inventory, acculturation
as measured by a questionnaire, and achievement motivation via
conformance were significantly related to achievement. Mental ability
was highly related to achievement, as was expected. There was a
substantial positive relationship between orientation to the values
of the dominant culture and achievement. The moderately high positive
correlation between self-concept and achievement suggests that
strong positive feelings about self are reflected to some degree
in higher levels of achievement for Indian students. Acculturation
and achievement motivation via conformance were reliably, but not
highly correlated with achievement.
The proportion of Indian students from English speaking homes who
were high achievers was significantly greater than from native
speaking homes. Apparently, there is a definite relationship between
the language of the home and academic achievement.
A differential between desired and expected occupations was obtained
for Indian students and was found to have a significant-positive
correlation with achievement, as well as with mental ability and
acculturation. It is hypothesized that Indian students scoring
high on the latter three factors tend to have relatively high vocational
aspirations but also tend not to raise their actual expectations
correspondingly, possibly for reasons having to do with minority
group status and cultural influences.
1 Coombs, L. Madison, et al. The Indian
Child Goes to School.
U. S. Department of the Interior, Bureau of Indian Affairs, Washington,
D.C., 1958.
|