The Indian Child Goes To School
CHAPTER III
A
COMPARISON OF THE ACHIEVEMENT OF PUPILS BY ADMINISTRATIVE AREAS
To
say that America is a land of infinite variety is to repeat a cliche.
The least discerning traveler cannot miss the topographical
differences between the flat wheatlands of North Dakota and the
wooded hills and streams of eastern Oklahoma. The Spanish influence
upon the architecture, speech, and tempo of life of many of the
communities of New Mexico and Southern Arizona will be noted by
the most casual observer. The climate of the hot and arid Papago
Reservation bears little resemblance to the humid, verdant home
of the Mississippi Choctaw. Both, in turn, are very different from
the high, cool tableland of the Blackfeet Reservation. Papago children
never see snow in their homeland, but Blackfeet children are treated
to a dazzling display of it as it covers, on many a winter day,
the entire towering range of mountains in Glacier National Park.
The variety of America, however, is not limited to its physical
aspects. Its peoples too, may differ greatly from community to
community or from one section of the country to another. Most of
us are aware of regional differences in accent, manners, and attitudes.
For example, the wealthy dowager of "Back Bay" Boston
and the wealthy Texas oil mall may have little in common except
their wealth. It has been pointed out often that the genius of
America lies in the fact that, diverse as they may be, our people
are drawn together effectively by the catalyst of democracy.
Yet, strangely enough, many persons seem to expect that if children
will only go to school, those of one community or region will learn
the same things at the same rate and at the same level of proficiency
as those of another. The data in this study strongly indicate that
this is not true. An enumeration of the principal tribal groups
included in this study, many with widely divergent culture patterns,
may help to give some clue as to the causes of the diversity of
achievement of the various area groups.
DIVERSITY IN THE POPULATIONS TESTED
The Indian Groups
As has been noted in the preceding chapter, the achievement testing
program was conducted independently in six different areas of the
Bureau of Indian Affairs. This was, of course, largely a matter
of administrative convenience. The areas themselves are somewhat
arbitrarily defined administrative units. The Phoenix Area, for
example, now includes all of the Indian groups in Arizona except
the Navajo, which is the largest. In this study the Indian children
of the Phoenix Area were mainly Pima, Papago, San Carlos and Whiteriver
Apache, and the Mojave and Chemehuevi of the Colorado River Reservation.
At the time of the study the Hopi were still under the jurisdiction
of the Window Rock Area.
The Albuquerque Area (now of agency status) served mainly the Pueblo
groups distributed along the Rio Grande River and westward from
it. In addition it included the Zuni, the Mescalero, and Jicarilla
Apache, and the Utes of Colorado.
The Indian population tested in the Aberdeen Area, which includes
North Dakota, South Dakota, and the northeastern corner of Nebraska,
was made up predominantly of the Sioux bands, a group of Chippewa,
and smaller numbers of Cree, Arickara, Winnebago, and other tribes.
In the Billings Area which embraces the States of Montana and Wyoming,
the Indian children tested were mainly Blackfeet, Crow, Cheyenne,
Assiniboine, Cree, Gros Ventre, Arapaho, and Shoshone.
The Indian children tested in the two Oklahoma areas represented
a multiplicity of tribes with the Cherokee and Choctaw predominating
in the Muskogee Area and the Kiowa, Comanche, Pawnee, Cheyenne
and Arapaho in the Anadarko Area.
These six administrative areas may be said to fall more or less
roughly into three cultural areas: first, the Southwestern tribes
of Albuquerque and Phoenix Areas; second, the Northern Plains tribes
of the Aberdeen and Billings Areas; and third, the Oklahoma tribes.
The Non-Indian Population
No implication is intended that Indian children alone are responsible
for the diversity of achievement among the areas. It should be
remembered that large numbers of White children were also tested
in this study. Of the total population tested, 42 percent were
white. The percentages of white children varied from area to area,
ranging from a low of 20.1 percent in the Phoenix Area to a high
of 59.1 percent in the Muskogee Area. This is shown in Table 3-a.
Table 3-a
POPULATION TESTED BY AREAS AND RACE
| Area |
White |
Percent |
Indian |
Percent |
Total |
| Phoenix |
433 |
20.1 |
1720 |
79.9 |
2153 |
| Albuquerque |
2290 |
46.9 |
2591 |
53.1 |
4881 |
| Aberdeen |
2860 |
37.3 |
4801 |
62.7 |
7661 |
| Billings |
1064 |
40.6 |
1555 |
59.4 |
2619 |
| Muskogee |
1955 |
59.1 |
1353 |
40.9 |
3308 |
| Anadarko |
1320 |
44.2 |
1666 |
55.8 |
2986 |
| Total |
9,922 |
42.0 |
13,686 |
58.0 |
23,608
|
Nor should it he assumed that the white
children in this study were homogeneous with respect to achievement. They were
far from it, as later evidence in this report will reveal. They came from many
different national stocks arid they, as well as the Indian children, undoubtedly
had their cultural differences.
Some Broad Cultural Differences Among the Areas
It would be more than presumptuous of the writers to attempt a definitive explanation
of the causes of differences in achievement level among the several areas.
Too many interacting factors are at play and too many intricate cross currents
of influence have been set in motion through the years to permit a clear-cut
analysis even by a qualified sociologist or ethnologist. It may not be out
of order, however, to suggest a few broad cultural differences which exist
among the areas and which may have some bearing on the level of educational
achievement.
It was not by mere chance, or because of lack of administrative planning, that
relatively few white children were tested in the Phoenix Area. The fact was
simply that relatively few white children lived or attended school near the
Indian children of most of the reservations of that area. The Apache and Papago
Reservations, particularly, are rather remote from white influence.
The Pueblo villages of the Albuquerque Area present a somewhat different situation.
Several, although not all, of them lie quite close to heavily traveled Federal
and State highways. The Pueblo peoples have embraced much of the dominant culture
of the country, but they have also tenaciously and successfully preserved much
of their own culture. The Pueblo peoples have been in contact with whites,
sometimes unhappily, since 1540, sixty-seven years before the Jamestown settlement.
In spite of this, a high percentage of the children in many of the villages
speak no English upon entering school. The non-Indian neighbors of the Pueblo
children are largely of Spanish extraction. Many of them have Spanish as a “first” language
and many of the children speak little or no English upon school entrance.
For the most part the Indians of the Aberdeen and Billings Areas live in relatively
open country where travel is comparatively easy. Furthermore, under the impetus
of the Allotment Act of February 8, 1887, many white persons purchased land
from individual Indians and moved on to Indian reservations, there to live
as neighbors of the Indian people. Much of this went on in the Aberdeen and
Billings Areas and resulted in what is often referred to as the “checkerboarding” of
the reservations. A great deal of intermarriage has occurred in these areas
between Indians and whites with consequent dilution of Indian blood. Relatively
few cases were found in the Aberdeen or Billings Areas of Indian children who
did not speak at least some English upon entering school. The white settlers
of these areas, on the other hand, were predominantly of northern European
stock who either had English as a first language or acquired it very rapidly.
Their culture patterns were similar to those of the dominant population of
the United States.
The populations tested in the Oklahoma areas have some background characteristics
peculiarly their own. Oklahoma is perhaps the most “Indian” of
all the States. It was Indian Territory long before it achieved statehood.
A high percentage of Oklahoma residents today claim some degree of Indian blood,
however minute. The so-called Five Civilized Tribes of eastern Oklahoma have
long been among the most sophisticated of all the Indian groups. They have
contributed many of the outstanding Indian leaders to the nation in the fields
of law, politics, the ministry, education, the arts, sports, and many other
lines of endeavor. The relatively low position of the Muskogee Area in the
hierarchy or achievement (see below) may come as a surprise then to many readers.
It should be made clear, therefore, that no claim is made that the findings
of this study hold true for all of the people of eastern Oklahoma but, rather,
only for those communities included in the study. The same word of caution
applies to all other areas. As has been said, the test was given in schools
operated by the Bureau and in nearby public and mission schools enrolling a
considerable number of Indian pupils.1 The writers feel that the population
tested in the Muskogee Area, both Indian and white, in general represents a
somewhat sequestered group of people. The Anadarko Area, which held first place
in the area hierarchy of achievement at the elementary and intermediate levels,
is similar to the northern areas in its topographical openness. While in general
its Indian people have not been in contact with white people for as long a
period of time as have those of the Muskogee Area, they have, nevertheless,
been in continuous and intimate association with whites for a good many years.
TABLE 3-b
SUMMARY OF THE RANKINGS OF THE AREAS
ReadingVocabulary
1. Billings
2. Anadarko
3. Aberdeen
4. Muskogee
5. Albuquerque
6. Phoenix |
Reading Comprehension
1. Billings
2. Anadarko
3. Aberdeen
4. Muskogee
5. Albuquerque
6. Phoenix |
Arithmetic Reasoning
1. Anadarko
2. Billings
3. Aberdeen
4. Muskogee
5. Albuquerque
6. Phoenix |
Arithmetic Fundamentals
1. Billings
2. Aberdeen
3. Anadarko
4. Albuquerque
5. and 6. Muskogee > Tie
Phoenix > |
Language
1. Anadarko
2. Muskogee
3. Billings
4. Albuquerque
5. Aberdeen6. Phoenix |
Spelling
1. Aberdeen
2. Anadarko
3. Billings
4. Muskogee
5. Albuquerque
6. Phoenix
|
Total Score
1. Anadarko
2. Billings
3. Aberdeen
4. Muskogee
5. and 6. Phoenix > Tie
Albuquerque > |
Overall Ranking
(Standard scores were assigned on
the basis of rankings on each skill and then totaled and
averaged.)
1. Anadarko
2. Billings
3. Aberdeen
|
4. Muskogee
5. Albuquerque
6. Phoenix |
|
THE HIERARCHY OF AREAS IN ACHIEVEMENT
Method of Obtaining a Rank Ordering
An attempt has been made to arrange the six areas, including both
races and all three of schools, into a hierarchy of achievement.
The method is firstly based on a comparison of mean raw scores
of the six areas for each of the six skills and total score for
each of the nine grades. The area having the highest mean score
on one of the skills at a given grade level was ranked as first,
the next highest was rank second, and so on down to the 'sixth
rank. To illustrate, at grade four the Muskogee Area had the third
highest mean of the six areas' for reading vocabulary for which
it was assigned a rank of three. The same area had the fifth highest
ranking mean on reading vocabulary at grade five for which it was
assigned a rank of five: This procedure was followed until each
area had been assigned a rank in each grade for each of the seven
means.
Table 3-b is a summary of all grades showing the rankings of all
the areas on all skills. This was effected by the method of assigning
a normalized standard score to each previously assigned rank..2 These standard scores of each area for each grade were then averaged
to obtain the summary skill rank shown in the table. Standard scores
assigned to the summary ranks of the areas in each skill were likewise
averaged to obtain an over-all ranking of the areas. It was then
possible to make tests for significance of difference between mean
standard scores assigned to the ranks.
No account was taken of the magnitude of differences between mean
raw score. However, the method did take into account the ranks
for all areas in all grades and skills and it is felt that a valid
hierarchy emerged.
The Areas in Rank Order
The final rankings of the areas, obtained by comparing; the mean
standard score assigned to area rankings, are as follows: 1) Anadarko.
2) Billings. 3) Aberdeen. 4) Muskogee. 5) Albuquerque. 6) Phoenix.
Significant differences between the means of standard scores were
found between all pairs of areas with the exception of Anadarko
and Billings, the two top-ranked areas. (See Appendix B). The hierarchy
of area achievement is thus rather clear-cut.
Differences Among the Areas
It should be noted, however, by reference to Table 3-b that the
position of the areas shifted rather frequently as among the several
skills. No area was consistently in first place. The Phoenix Area
was never higher than a tie for last, but no other area held a
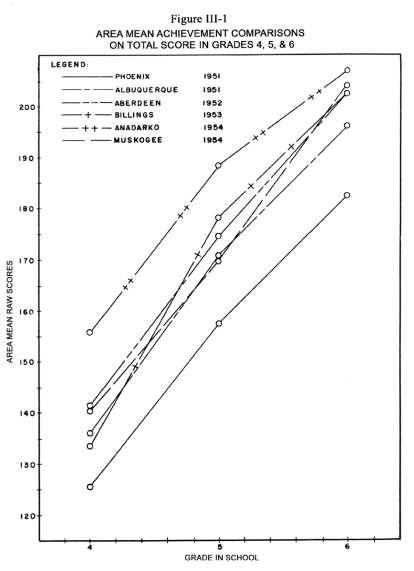
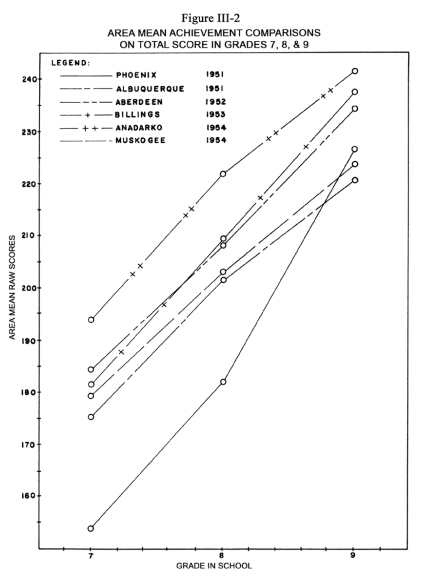
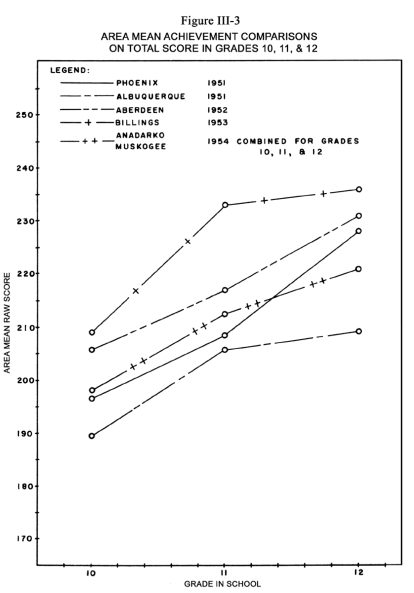
particular rank unvaryingly throughout all of the skills. Figures
III-1, III-2, and III,3 show this same tendency for areas to shift
positions in the hierarchy as among the nine different grade levels,
with “total score” only being considered. Without attempting
to point out all of these variations, it may be remarked that the
Anadarko Area was without exception the highest in grades four
through nine. However, when combined with the Muskogee Area (from
which it was not statistically different) at the advanced level,
it fell to a third and fourth place tie for grades ten and eleven,
and to a fourth and fifth place tie in grade twelve. The Phoenix
Area was unvaryingly lowest in grades four through eight, but rose
to fourth position in grade nine, fell to fifth in grades ten and
eleven, and rose again to third position in the twelfth-grade level.
Other shifts in position in the hierarchy, by the several areas
among the different grade levels, will be revealed by an examination
of Figures III-1, III-2, and III-3. These shifts in position do
not invalidate the general ranking of areas as indicated above.
They do serve to call attention to a fact which is not revealed
by the mere comparison of mean achievement of the areas and that
is the great amount of overlap in the range of achievement among
them. Even in the Phoenix Area,
which was most consistently ranked as lowest, there were many individuals
who, in each skill, scored higher than some individuals at their
grade level in any of the other areas. The next section will illustrate
what percentage of pupils could be considered above average, average,
or below average in any skill, for any grade, in an area.
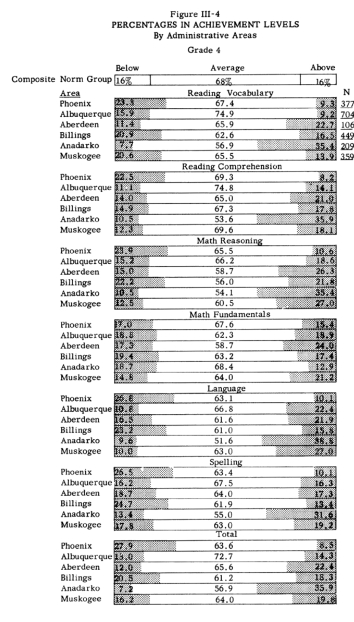
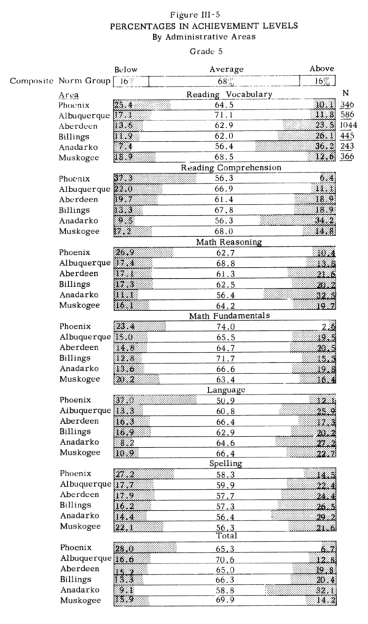
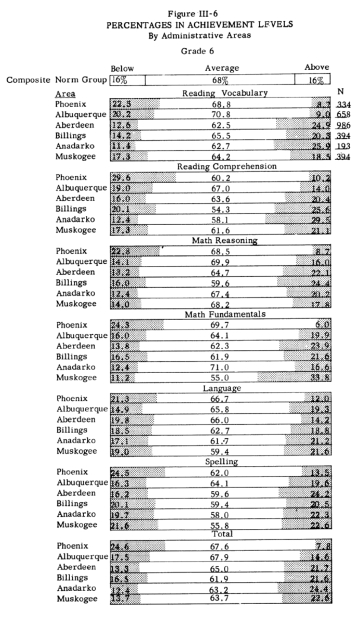
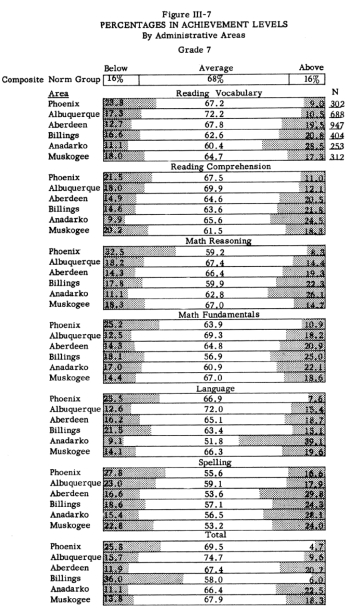
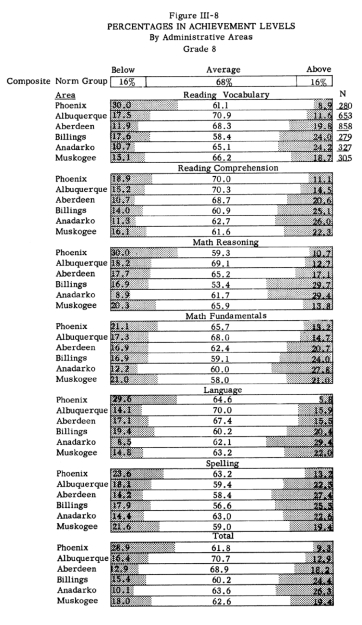
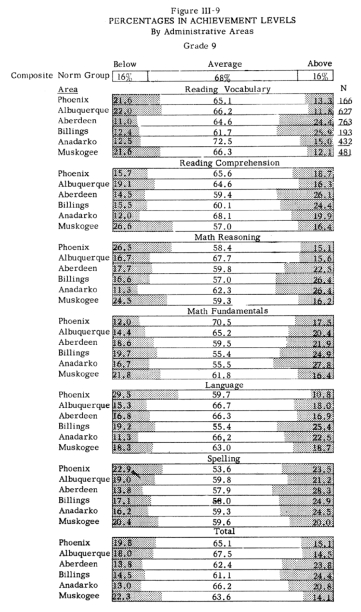
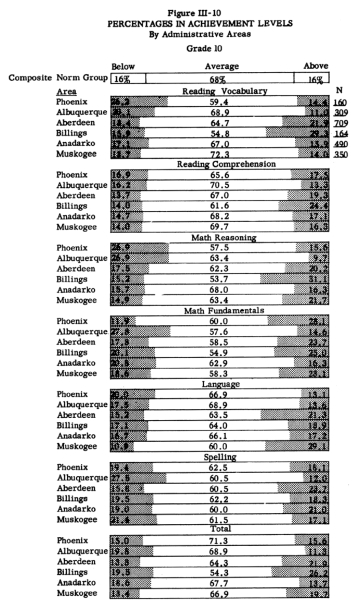
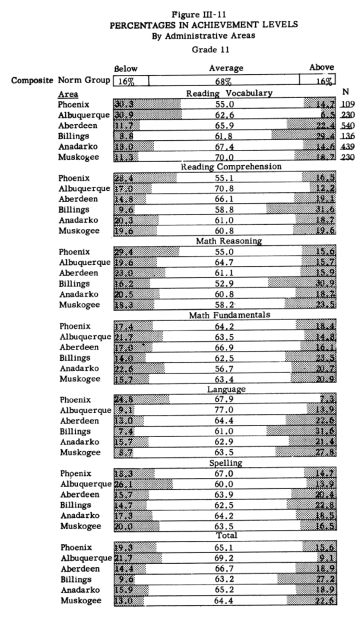
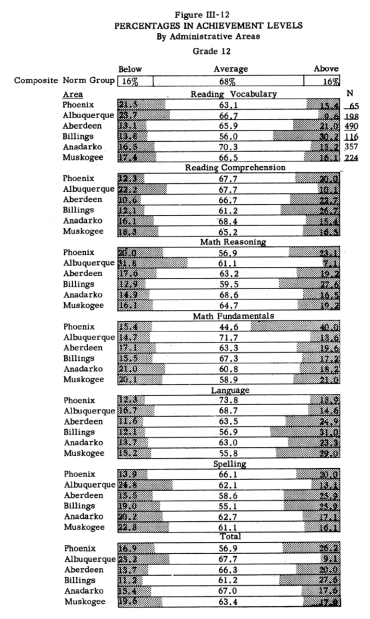
COMPARISON OF AREAS IN RELATION T() A COMPOSITE NORM
Derivation of the Composite Norm
A different approach to comparing achievement in the six different
areas is shown in Figures III-4 through III-12. Here the achievement
of pupils in each area is compared with that of a composite norm
group composed of all the pupils, both Indian and white, tested
in all six areas. The comparison is broken down by grades and by
skills. The composite norms were established by calculating the
raw score mean and standard deviation for the composite group on
each skill, and total score, for each grade level. Raw score values
were then fixed at the mean and plus-and-minus one standard deviation
from the mean for each grade. Assuming that the distributions are
normal, approximately 68 percent of the cases fall between the
raw scores at plus-and-minus one standard deviation from the mean;
about 16 percent fall above plus 1 S.D.3 and the remaining 16 percent
below minus 1 S.D.3 These three strata of achievement are shown
in the scale at the top of each figure and are designated as “average,” “below
average,” and “above average.” This scale serves
as a standard for comparison.
Use of the Composite Norm to Define Levels of Achievement
The pupils in the several areas, of course, achieved differently
from each other and also differed from the composite norm group.
These differences are shown, by the device described in the preceding
paragraph, in Figures III-4 through III-12. For example, Figure
III-4 shows that in reading vocabulary 67.4 percent of the pupils
tested in the Phoenix Area were average. This is not different
from the normal percentage. However, 23.3 percent were below average,
whereas in the norm group only 16 percent were at this level, and
9.3 percent were above average; considerably fewer than the normal
16 percent. On the other hand, the Anadarko Area had a smaller
proportion of pupils in the average range, 56.9 percent as compared
to 67.4 percent for the Phoenix Area and 68 percent for the norm
group. Of the Anadarko fourth graders, only 7.7 percent were below
average in reading vocabulary, however, and 35.4 percent were above
average. This compares with 23.3 percent and 9.3 percent for the
Phoenix Area and 16 percent and 16 percent for the composite norm
group. All of the graphs in Figures III-4 through III-12 should
be read in this manner. The number of pupils in each group is shown
in the column headed by “N.”
Reasons for Developing Differentiated Norms
The composite norm group was used for the purpose of demonstrating
the desirability of developing separate sets of norms for each
of the six areas. The make-up of the composite norm group by grade
levels is shown in Table 3-c.
Table 3-c
NUMBERS IN THE COMPOSITE GROUPS
| Grade 4 |
3206 |
Grade 9 |
2834 |
| Grade 5 |
3077 |
Grade 10 |
2314 |
| Grade 6 |
3006 |
Grade 11 |
1723 |
| Grade 7 |
3056 |
Grade 12 |
1527 |
| Grade 8 |
2867 |
Total |
23,608 |
The achievement on “total score” of this group of children,
by comparison with that of the normative population of the California
Achievement Test (the “national norm” group) is shown
in Figure III-13. Here achievement is expressed in terms of “grade
equivalent” scores. An inspection of Figure III-13 reveals
three very interesting findings. Two of these are related to reasons
for developing differentiated norms. The third will he treated
separately.
Difference in Achievement by Grade Based on Composite and
National Norms. First, with each successive grade within a level, the mean
scores of the children in the present study fell farther below
the published norms of the California Achievement Test. To illustrate:
since a great majority of the pupils in the present study took
the test in October, or the second month of the school year, we
will consider their actual grade placement to be 4.1 for fourth
graders; 5.1 for fifth graders, and so on.4 The mean, or average,
score for the composite group of fourth graders fell at the 4.3
grade level and that for fifth graders at 5.0. This may be considered
as not different from “normal” achievement within the
meaning of the published norms. However, sixth-grade pupils were
at grade 5.5 or .6 of a grade level lower than the published norms.
Seventh-grade pupils were at grade (6.6, eighth graders at 7.2,
a retardation of .9 of a grade level, and ninth-grade pupils at
grade 7.9 or 1.1 grade levels below “normal” achievement.
The comparison is even less favorable for students in the senior
high school grades. Those in grade ten were achieving at grade
9.2, those in eleventh grade at 9.9, and twelfth-grade students
were at grade 10.2, a retardation of 1.9 grade levels below the
published norm.
What accounts for the tendency of the pupils in our present study
to fall progressively lower than the published norms of the test
used? The investigators do not claim to know all of the reasons,
which may be many and varied. Some of the possible reasons have
been discussed in Chapter 1. Further reasons were indicated in
more detail in the first sections of this chapter. The children
tested in this study were obviously different in many aspects of
cultural background and environment from those whose test scores
were used to establish the published norms. This fact seriously
invalidated the published norms for use with the population of
the present study. The phenomenon illustrated above helps to show
this lack of validity, although it may not be considered an adequate
argument in itself for rejecting the use of the published norms.
Since we should not consider norms as standards of achievement,
to have rejected the published norms simply because our population
did not achieve “up to” the level of the norms would
not have been a sound technique of evaluation. However, to have
used with our population norms established on a population quite
different from them in many respects other than achievement would
have been highly unsatisfactory. We have also pointed out that
the areas in our study were culturally different enough from each
other to warrant establishing separate norms for each of them.
Reference to Figures III-4 to III-12 may help to show how the areas
differed from each other in achievement in relation to the composite
norm.
Lack of Continuity of National Norms Between Levels of
the Test.
A second finding which indicates the lack of validity of the published
norms for use with the population of students under consideration
is also illustrated in Figure III-13. It will be observed that
between grades six and seven and again between grades nine and
ten there is an unrealistic rise in grade equivalent scores when
compared with differences at grade levels above and below them.
The reader will recall that between these grade levels (six-seven
and nine-ten) the test battery changes. The differences between
grades four and five and grades five and six were .7 and .5 of
a grade, respectively, but the difference between grades six and
seven was 1.1 grades. Similarly, the difference between grades
seven and eight was .6 of a grade and between grades eight and
nine it was .7 of a grade, but between grades nine and ten the
difference increased to 1.3 grades. In keeping with the pattern,
the difference between grades ten and eleven fell to .7 of a grade
and between grades eleven and twelve dropped to a mere .3 of a
grade level. Almost without exception, whenever this type of graph
was drawn for any group in the present population on any skill,
this phenomenon occurred. The investigators do not pretend
to know the reason for this unless it tends to occur with a population
which generally achieves lower than the normative population of
this particular test or is an artifact of the method of standardization.
This function of the published norms was noticed by the investigators
in the case of separate areas long before a composite mean was
computed and was a principal reason for the early decision to establish
separate or differentiated norms.
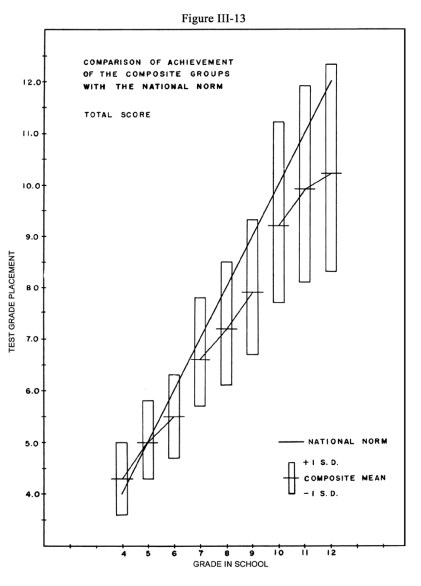
Increasing Variability With Upper Grades
The third finding, which merely confirms the findings of many earlier
studies, has to do with the variability of scores of the several
grade populations. The vertical bars in Figure III-13 indicate
the range of achievement between plus-and-minus one standard deviation
from the mean for each of the grades. It will be observed that
the range is progressively larger as the higher grades are reached.
Children in a grade tend to be less like each other in achievement
the farther they go in school.
1. There were no mission schools in the Anadarko or Muskogee
Areas.
2. Cf. K.E. Anderson, R.T. Gray, and E.V. Kudstedt.
195A Tables for transmutation of orders of merit into units of
amount. Journal of Experimental Education, XXII:247-264.
3. According to statistical tables of areas and ordinates of the
normal curve, more nearly exact percentages would be 68.26 percent,
15.87 percent, and 15.87 percent, respectively.
4 California Achievement Test Manual, Elementary
Level, P.7.
|