|
HOW WELL ARE INDIAN
CHILDREN EDUCATED?
Chapter Five
RESULTS ON TESTS CONSTRUCTED
FOR THE USIS PROGRAM
Two types of tests were constructed for use
in the Indian Service testing program. In the first group, the
Rural Practices tests
were designed to measure the students' understanding of some
of those things emphasized in the Indian School curricula. It was
recognized that most Indian environments fail to provide certain
types of training which most rural white children are believed
to receive in their home and out-of-school experiences. The Rural
Practices tests include those objectives dealing with the students'
understanding of the uses and conservation of natural resources,
health and safety factors, home economics, and credit. The second
type of test included instruments designed to measure the students'
ability to write correctly. The figures in this chapter describe
the achievement of the students in the various groups and areas
in those fields in which these special examinations were constructed.
In the 1945 program a general resources test was administered
to all of the eighth grade students and regional resources tests
were
given to the boys in three areas. Because of the limited usefulness
of the regional tests, they were not repeated in the 1946 program,
though many of the items were rewritten and utilized in the extension
of the general test.**
Figure V-1 gives the norms for the eighth and twelfth grade students
on the extended general resources test, which was administered
in 1946. The medians of the various groups and areas vary considerably,
with the public school group at both eighth and twelfth grade
levels demonstrating the greatest competence. The superior performance
of the public school students is interesting and surprising in
view of the nature of the test, which like the other rural practices
tests, was constructed to measure concepts specifically stressed
in the Indian school curriculum. It was thought that the Indian
students in public schools would constitute something of a control
group in measuring the degree of effectiveness of the instruction
in resources given in the Federal schools. Although the Indian
students in public schools at both the eighth and twelfth grade
levels did less
well than white children, they demonstrated higher competence
than the students in any of the Indian schools. This would indicate
that the formal instruction given in the Indian schools does
not equal in effectiveness the training in general resources
which is gained through informal channels by students attending
the public schools. In other words, results indicate that the
training in resources provided by Indian Schools is not sufficient
to compensate for the lack of out of school experiences.
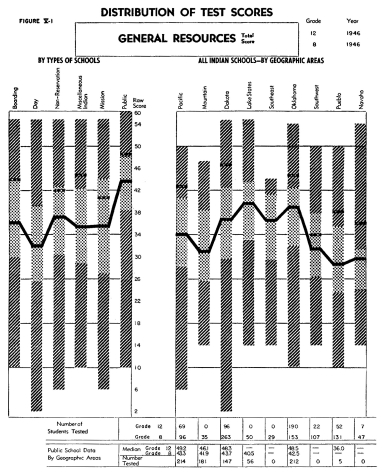
It was thought that this trend, as indicated in the 1945 battery,
might be partly explained by the fact that the items included in
this examination were those which were of such a general nature
that they were labeled as suitable for Indian students in all of
the areas. Such criterion of selection would naturally produce
a test that would include a wide sampling of items, most of which
would be relatively easy. If this sample of items were fairly easy,
it would be highly probable that most of these same facts and principles
had been discussed and described in story books, science magazines,
story magazines, magazine advertisements and newspapers, thereby
giving any student who did a fair amount of reading as good a chance
for knowing these items as the student who had experienced these
facts first-hand on the farm. Therefore, it was thought possible
that the test, as developed in 1945, might not have been discriminating
between actual firsthand training and experience and the kind of
information that could be gained by reading magazines and newspapers.
It was for this reason that the 1945 general resources test was
extended, making it three times as long as the original test. When
it was observed that the data from the 1946 program revealed the
same trends, it was concluded that the construction of the original
test and the seeming simplicity of some of the items probably could
not account for the better performance of the public school students.
In other words, the differences indicated are probably due to a
failure on the part of the Indian Schools, despite their recognition
of the problem, to provide instruction that will as yet offset
or balance that training which the public school student receives
in his out-of-school experiences.
Tables V-1 and V-2 graphically present data on the relative difficulty
and discriminating value at the eighth grade level on each of the
twenty items of the 1945 General Resources Test. These twenty items
are identical with the first items in the 1946 test. Table V-1
presents the data for the Southwest Area and Table V-2 for the
Dakota Area. These two areas were selected for comparison because
they constitute relatively large groups, each having recognized
differences. Also, at the eighth grade level, each of the two areas
includes a fairly good representation of the different types of
schools, although for this comparison, data from only the public,
day and non-reservation schools have been used.
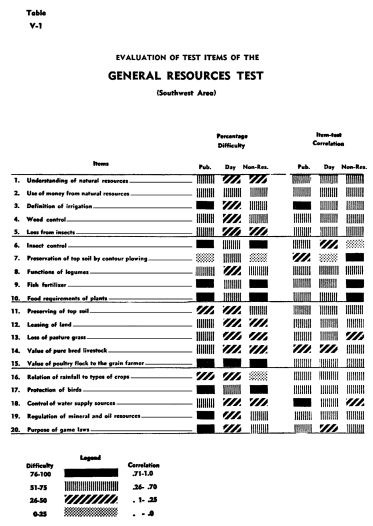
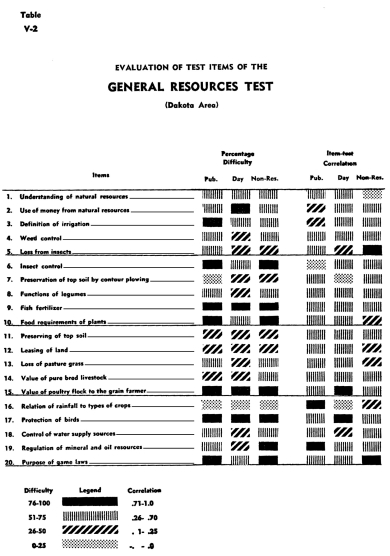
Per cent of Correct Responses means the per cent of students answering
any particular item correctly. For example, in item number 3, which
calls for a definition of irrigation, more than 3/a of the public
school students answered it correctly, while between 1/4 and %2
of the day school students and %2 to 3/a of the non-reservation
students were able to answer it. In this particular item there
is a difference between the achievement as demonstrated by the
students in the three different types of schools. Table V-2 shows
that the item has about the same difficulty in the Dakota area
as in the Southwest for both the public and non-reservation students,
but the day school students in the Dakota area found the item easier
than did the day school students in the Southwest. In instances
such as item number 15, on the value of the poultry flock to the
grain former, the item was extremely easy for the students in all
three types of schools and in both areas. This type of information
relative to individual items allows the instructor and the supervisor
to tell something about the specific items and objectives that
are apparently being taught more effectively in one type of school
or in one area than in another.
In general, it may be concluded that while some specific items
show considerable variability in difficulty from school to school
and area to area, there are a great many items that are mastered
about equally well in the various types of schools and in the different
areas. While the public school students in the Southwest do equally
as well or better than the other two groups, there are only two
items-numbers 7 and 11-in which Indian training seems to have resulted
in superior performance. Items numbered 2, 7, 14 and 19 in the
Dakota area show the Indian students doing better than the public
school students.
The discriminating value or item-test correlation provides an index
as to relative usefulness of the item in selecting the students
who have performed very well I on the test as a whole from those
who have not done so well. In this particular instance, these data
were computed by comparing the performance on the basis of this
particular test, of the students in the top half of the class,
with those in the bottom half of the class. Items such as those
numbered 3 and 18 have item-test correlation values of better than
.70, which means that there is a very high correlation between
the public school student's performance on these items alone and
what he is able to do on the test as a whole. It is interesting
to note that items that are discriminating for public school students
are relatively discriminating for the Indian school students as
well. In other words, items that will select able students in one
type of school are nearly as useful in other types of schools for
selecting the good students from the poor ones. It is also gratifying
to note that a relatively high percentage of the items have discriminating
values of better than .25, for some test builders employ this
figure,
including as good items those having higher values than .25.
There are relatively few instances in which a zero or negative
relationship is exhibited. A zero relationship might indicate
that the material had not been taught and a negative correlation
might indicate that the instruction concerning the item was contrary
to the response considered correct by those who constructed the
test. Of course, zero or negative correlations may also be interpreted
as indicative of weaknesses in the item, or in the way that it
has been stated, but in view of the fact that all of these items
have merit in most schools and areas, the negative correlations
probably do not reflect weaknesses in the test item itself. Item
16 from the Dakota area is a case in point. The item is very
discriminating for the public school students and somewhat so
for the non-reservation school students, but for the day school
students it may point to the fact that this item is not taught
or that a certain amount of misinformation may have confused
the students.
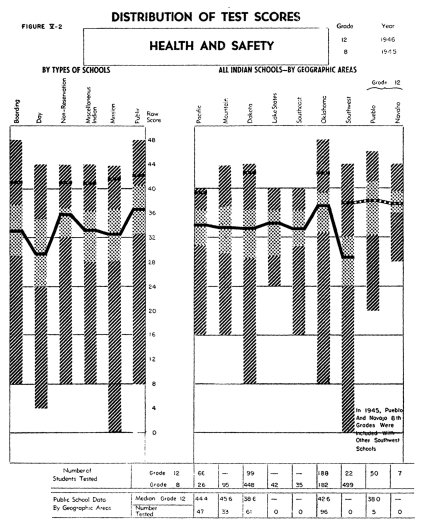
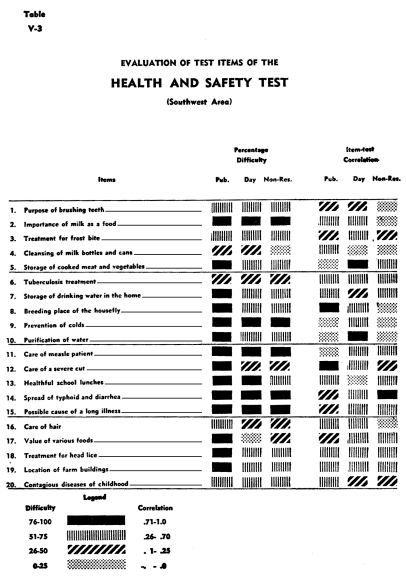
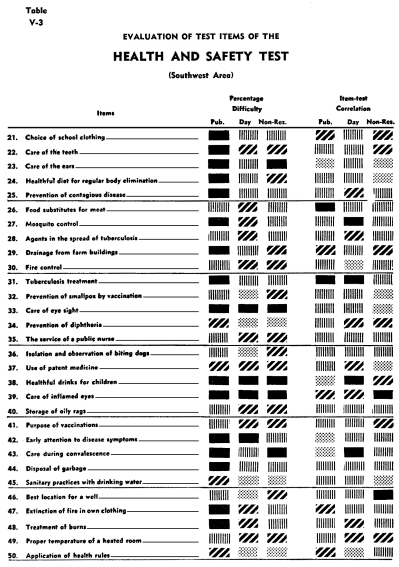
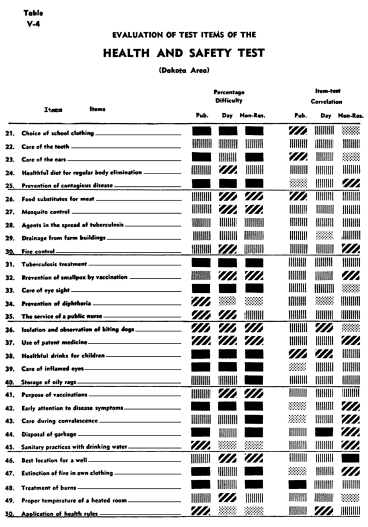
Figure V-2 is the norm sheet for the Health and Safety Test. Tables
V-3 and V-4 describe the content of all fifty items as well as
showing the relative difficulty of the various items and their
degrees of discrimination.
Figure V-2 reflects tremendously wide ranges of performance between
the students in each of the groups but in most instances the differences
between the medians of the groups are not large enough to be important.
Though the students in the day schools demonstrate the poorest
performance at the eighth grade level, there is almost no difference
between the students in the various types of schools at the twelfth
grade level. . In the Dakota region the twelfth grade students
in Indian schools did a little better than the students in public
schools, and in Oklahoma, students in the two types of schools
did equally well. The results would indicate that health and safety
instruction in the Indian schools has been sufficiently effective
to compensate for the students' lack of home training.
This test furnishes a good example of the usefulness of item-by-item
analysis of the test data. The instructor will find much of interest
to him in Tables V-3 and V-4, for these tables reveal the specific
topics in which the eighth grade students from the three types
of schools of the Southwest and Dakota areas encountered varying
degrees of difficulty. For example, item 10 measures the students'
understanding of the health and safety factors contributed by the "purification
of water." In the Southwest it will be noted that the item
was very easy for the public school students, having been answered
correctly by more than three-fourths of them. In the day and non-reservation
schools, the students found this same item somewhat more difficult.
The symbols in the right hand columns describe the discrimination
values of the items. Among day school students, item 10 was highly
discriminating, for it was easy for the good students and difficult
for the poor students.
In the cases of both the public school and non-reservation students,
the item is shown to possess negative or zero discriminating
value. For the public school students, this lack of discrimination
should modify the interpretation that has probably already been
given by those who have observed that the public school students
are well informed on the item of water purification. While it
is still true that they are relatively well informed, it is also
of importance to know that the poorest students in this group
do just about as well as the best students in the class. When
an item has been thoroughly and effectively taught to a class,
it is often found that both the poor and good students, as measured
on the test, show near perfect performance on the item. On the
other hand, the fact that good and poor students do equally well
could also mean that this item was not taught in school but that
the students have acquired the information elsewhere. For the
non-reservation students in the Southwest item 10, on water purification,
appears to be relatively easy, but is not discriminating. One
would conclude, therefore, that in this area, the understanding
of water purification among non-reservation students is not a
good index as to whether they understand all of those factors
which have been included in this test on health and safety. Specific
teaching of the water purification topic should have the effect
of increasing the discriminative value of this item the next
time such a test is given, for the better students will in all
probability have their scores improved much more than will the
slower or poorer students. The discriminating value of item 10
has not been computed for the twelfth grade data. It is possible
that the teaching in the four-year period between eighth and
twelfth grades will be found to have produced a higher discriminating
value for the item on the twelfth grade tests.
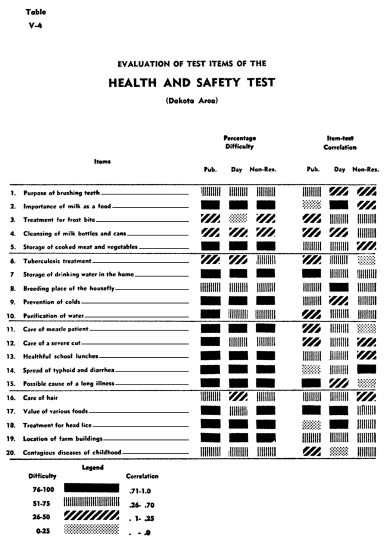
The non-reservation students in the Dakota area find item 10 about
as easy as do the students in the Southwest, but in the Dakota
area, the item is highly discriminating. This could be interpreted
that there has been a more definite effort to teach water purification
to the non-reservation students in the Dakota area than to the
students in the Southwest.
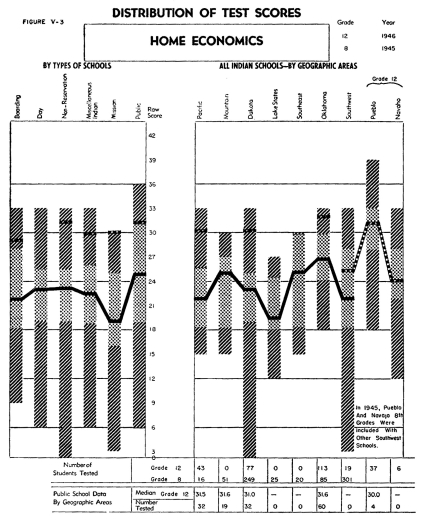
Figure V-3 shows the distribution of test scores for the Home Economics
Test. This test was designed as a companion for the General Resources
Test and was given to all of the eighth and twelfth grade girls.
No regional tests were prepared because the subject matter included
was judged to be of importance to the girls in all areas. The performance
of the girls on the Home Economics Test is about the same for all
types of schools with the exception of the eighth grade girls in
mission schools who fall somewhat lower. The performance of the
Oklahoma Indian school group, at both the eighth and twelfth grade
levels, is higher than that of the total public school group
at comparable
grade levels. This is of special interest when one
considers that the test was prepared to measure the degree to
which the Indian Schools have been successful in their attempt
to compensate for the lack of home training which their students
receive in relation to good homemaking practices. The fact that
this performance is due to instruction in Indian schools is pointed
to by the fact that the public school Indian students do less
well than the non-Indian students.
Tables V-5 and V-6 present an evaluation of the items in the Home
Economics Test. As in the previous item evaluation, these data
have been computed for the Dakota and Southwest areas. Examination
of these figures will disclose much more agreement than might be
expected. The few items, such as numbers 2, 9, 21 and 28, that
are very difficult for all the students seem to be difficult for
the students of both areas and for the students in all three of
the types of schools. Therefore, if this difficulty is due to the
material not being taught or being taught incorrectly, the fault
is not characteristic of a single type of school or of the schools
in either of these areas. The same thing may be said for the items
which appear to have been easy, such as numbers 3, 5, 7, 12, 14,
16, 25, 27, 33, 35, and 38. All of these items appear to be fairly
easy for students in all three types of schools and in both areas,
again showing no appreciable deviations.
The curriculum expert would probably look for more instances such
as items numbered 18, 26, and 37 in the Southwest, for here in
Table V-6 are examples of the three types of schools in this area
demonstrating three levels of proficiency. While these three items
will undoubtedly be of passing interest, the fact that only three
items have such ranges is hardly enough to make anyone think that
there are significant differences in the attention given to Home
Economics. On the whole, the discriminating values for the Indian
School groups are higher than for the public school students, and
this is additional evidence that the test measures achievement
of topics stressed in the Indian School curriculum.
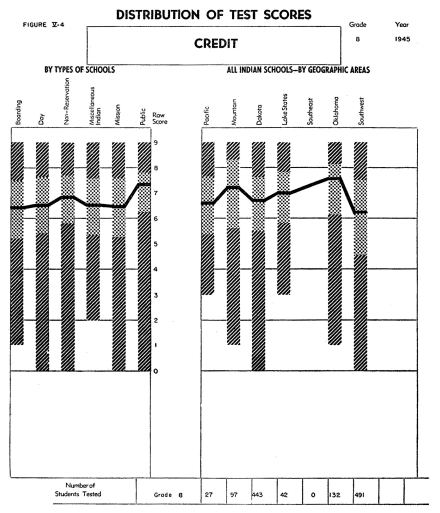
Figure V-4 is a norm sheet describing the achievement of students
on a test which has been called the Credit Test. The purpose of
this examination was to determine the kinds of conditions or situations
which the students felt would justify the granting of credit or
loans. Various situations were described in each item of the examination
and in each case the student was expected to decide whether or
not the situation was such as to warrant the giving of credit.
The situations were so set up and described as to convince those
responsible for the test that the situations were typical and that
all of the items could be keyed. The situations chosen were those
which students might have observed and which due to their own training,
lack of training, or prejudice might answer incorrectly. The results
from a test of this sort therefore reflect a great many things.
Certainly it would not be wise to
interpret the results as a measure purely of educational opportunity
or direct training in the classroom, for the training, whatever
it might be, is modified so much by home experiences. Therefore,
it is possible to think of this test partly as one measuring
attitudes and its results should be examined diagnostically with
that in mind.
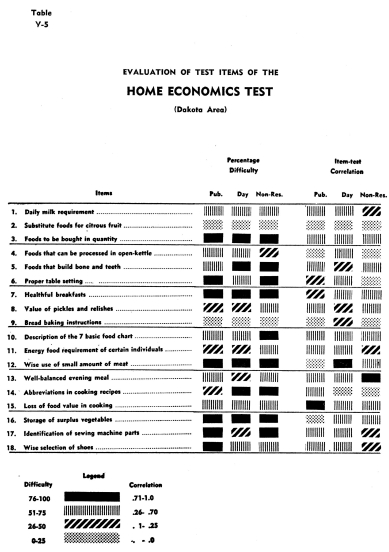
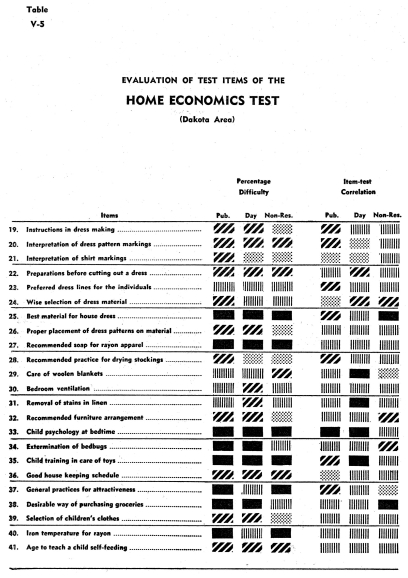
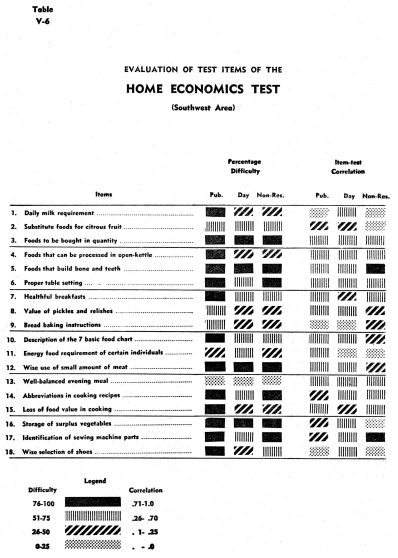
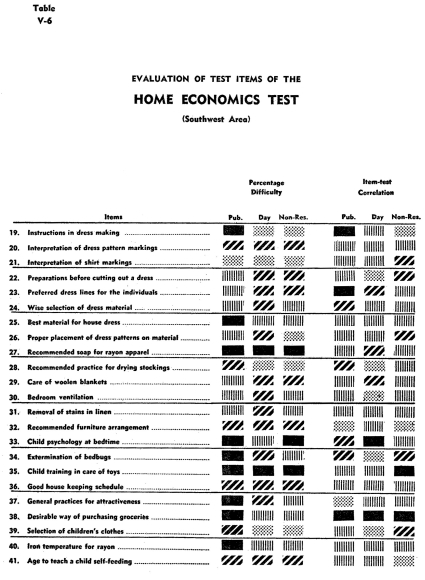
Figure V-4 illustrates that there is relatively little variability
between the median attainment of the different types of schools,
but somewhat more variability between the Indian schools in the
different regions. In this test the Oklahoma group is highest,
even higher than the median for all public schools. Analysis of
the test items showed that none of the items gave negative correlation
values. In fact, most of the correlation values were relatively
high, showing a high degree of discrimination. However, the credit
test was not repeated in 1946 for it was planned to incorporate
these, or modified items, in a longer test designed to measure
a wide scope of attitudes. This test is still under construction.
A Rural Practices Vocabulary Test was constructed for administration
in the 1946 program. Its purpose was not that of a general vocabulary
test, but rather that of measuring the degree to which the students
understood the vocabulary being used in the rural practices tests.
The purpose of the test has been fulfilled when it has been discovered
that:
1) the achievement of all students on this select vocabulary is
relatively high, thereby indicating that the word difficulty of
the rural practices tests was not a serious handicap;
2) a positive correlation between the vocabulary -and rural practices
scores exists; and
3) the results have been made available to the teacher in order
that the scores on the special vocabulary may be used in the analysis
of individual student scores on the rural practices tests.
The second type of tests constructed for use in this study are
known as the Free Writing Tests. It was decided that the standardized "proof
reading" type of English test was inadequate to measure the
students' skill in written expression. The standardized test measures
the students' ability to detect errors in printed material; the
Free Writing Tests measure the students' ability to use English
in expressing his own thoughts clearly and correctly.
In 1945 two forms of the Free Writing Tests were given to each
of the eighth grade students. Because Form A of the test appeared
to motivate a freer type of expression, this form of the test was
given in 1946 to all of the fourth and twelfth grade students.
Unfortunately, the extent to which the method of interpretation
of results would be altered was not anticipated in time to indicate
the desirability of repeating the test at the eighth grade level.
Objective scoring of the Free Writing Tests is somewhat more difficult
than the scoring of most standardized tests, but the results
indicate that it is a better measure of the type of language
skill which Indian schools are attempting to develop. Each of
the 1946 papers was scored in three ways to determine:
1) the total number of errors in spelling, punctuation, usage and
sentence structure,
2) the maturity of English construction attempted, and
3) the types of errors most common at different grade levels and
in different geographic areas.
A fourth type of analysis which is recognized as important, but
which has not been undertaken thus far, is a qualitative analysis
of the ideas expressed-the abiIity of the writer to sustain the
reader's interest, his imagination and creativeness.
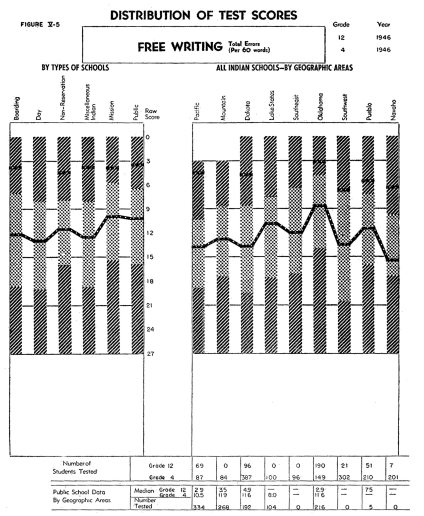
Figure V-5 shows the results or norms for the Free Writing Tests-Total
Errors Per Sixty Words for the fourth and twelfth grade students
in 1946. The distribution of scores on the 1945 study are not shown
because the revision in method of analysis yielded scores which
are not comparable to those reported in 1945. The unit of sixty
words in each composition was decided upon because the opportunity
for error increases in proportion to the length of the composition.
Experimentation indicated that there is considerable consistency
in the number of errors which occur throughout the composition.
A correlation of .872 was found between the error score based upon
sixty words of a composition and the error score of the entire
composition. It was therefore decided that sixty words was a sufficiently
reliable sample of the whole.
The opportunity for error likewise increased in proportion to the
increase in complexity of the composition. For example, a student
may entirely eliminate errors in either omission or wrong use of
commas by using only simple sentences where periods are adequate.
There are fewer opportunities for errors in sentence structure
if he uses short, choppy sentences.
The following fourth grade compositions serve to illustrate the
importance of considering complexity as well as the total number
of errors in making comparisons between the achievement in the
Free Writing skill of different students.
(Example)
The man is riding on a horse. A dog is going with him.
The man is going to the hills. A girl is standing by the door.
She is telling
him to be back before sundown. There is a little house a little
way from the house. The dog stays in the little house.
There are trees… Hemill
bring a rabbit.
In contrast to the simplicity of this paper, the following sample
illustrates the opportunities for error, and resultant errors which
occurred through the introduction of complex and compound sentences.
(The 60 word sample in heavy face type indicates the 60 word sample
which was used as a basis of computing the total error score.)
(Example)
This Indian is going out toward the mountains to kill large game
for his family, and he is taking one of his best dogs with him.
He is going out because his family do not have anything to eat
in their house for supper.
He is the only Indian warrior in the camp, because just his family
and him are the only ones there.
The little girl at the door is trying to tell him to bring back
a live baby deer for her pet.
After he's gone a little way She tells him Goodbye and then go
back into their little house.
The mountains are high and rocky but the Indian is going out to
hunt. The Indian man will return soon, from his long hunt in the
mountains. The Indian man told the little girl that he would kill
a deer and bring back two baby deer for the little Indian girl's
pet. The little girl is so happy that she claps her hand and tells
him to take care of himself on the journey.
After along time the little girl wonders why her father hasn't
returned yet. But her questioned is soon answered, for out in the
open spaces comes some Kiwoa Indians to the camp to get the women
and children and make slaves out of then and take them home to
their houses.
But that was not all because the little girl saw out in the opening
saw her father coming across the broard plan with something on
the pony's back and two baby wolfs in his arms instead of deer.
When the Kiowa Indians saw him coming they ran off and were never
seen again because the man had brought back other warriors who
were part of the people. There were about 49 people who were with
them then. and then they lived happily together and when the wolf
got big she littered.
Since many errors in punctuation result frorn wrong use, it was
decided to show the opportunity for errors in punctuation by counting
the number of different kinds of punctuation marks which the student
attempted to use. Only those which were used in the 60 word sample
were considered in determining the qualitative punctuation score.
The number of different words of more than one syllable was used
as an index of the student's attempt to use complex words. Obviously
a student with limited spelling ability might make relatively few
errors if he used only simple words which were easy to spell. Since
a misspelled word was counted an error only once, the use of an
index which indicated different words was suggested since repetition
of the same word decreased the opportunity for spelling errors.
The third type of analysis of the Free Writing papers involved
a careful study of the specific types of errors found in the papers
of the different Indian students. This study was made by means
of careful sampling of the papers of both fourth and twelfth grade
students in each of the geographic areas. The samples were grouped
so that the findings indicated whether an error was typical of
all students at this grade level, or only of those who made many
errors.
It was found that there was marked similarity, both in type and in frequency
of errors, between the poorest twelfth grade and the best fourth grade papers:
With the exception of errors in the use of the comma, the frequency of each
type of error was considerably higher among the fourth grade students. In the
case of the comma errors, it seems probable that the opportunity for comma
errors was markedly increased by the greater complexity of the twelfth grade
compositions, for the twelfth grade students made more errors in the use of
the comma than did the fourth grade students. The largest percentage of errors
among all fourth grade papers were those of omission of capital letters at
the beginning of sentences. Almost as many errors at the fourth grade level
were in the capitalization of common nouns and the use of a capital letter
at the beginning of each line: The total number of errors in the wrong use
of the capital letter was greater than those resulting from omission of capital
letters. This difficulty in the use of capital letters in the fourth grade
may spring from the fact that most Indian Schools do not place as much emphasis
on the proper use of capital letters in the lower grades as is customary in
the average public school. This omission is deliberate, and designed to simplify
the problem of alphabet recognition for pupils coming from nonreading homes.
The most frequent errors in sentence structure were classified as "awkward
and dangling sentences and modifiers." Among the poorer twelfth grade,
and most of the fourth grade papers, the "run-on sentence" accounted
for a large percentage of errors. The verb error which occurred with greatest
frequency at both grade levels was in lack of agreement with the subject in
person or number. At the fourth grade level the omission of the verb or auxiliary
and the omission of an "ing" ending was common. The most frequent
noun errors were those which resulted from a confusion of plural and singular
forms. A relatively large percentage of errors resulted from mistaken identity
of words. It is interesting to note that almost no double negative errors occurred
at either grade level.
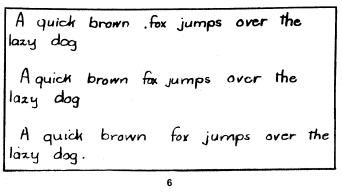
It was noted by those who scored the 1945 Free Writing tests that the illegibility
of the penmanship sometimes made it difficult to determine whether or not the
student had misspelled a word. It was decided that the quality of student penmanship
should be studied in 1946.
Because it has been suggested that there is no merit in forcing a child to
transfer from manuscript to cursive writing, students in many of the Indian
schools continue to use manuscript writing throughout their entire period of
school attendance. It was therefore necessary to employ two separate Handwriting
Scales?one for judging the quality of cursive writing and one for manuscript
writing.
A large number of scales were examined for their possible usefulness in evaluating
the quality of handwriting. It was necessary that the range of the scale should
be wide in order that it would extend from the poorest penmanship of the fourth
grade students to the best penmanship of the twelfth grade students. All of
the scales examined appeared to discriminate between finer differences in quality
than seemed either justifiable or necessary. An attempt was made not to require
the distinction between extremely small differences so that there would be
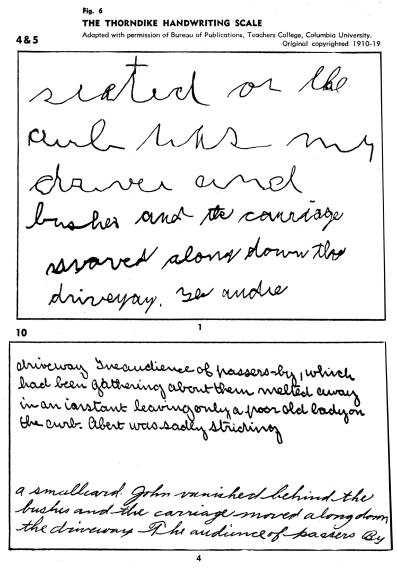
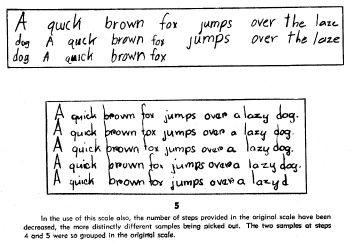
no disagreement between the judges. Cursive writing was evaluated by comparison
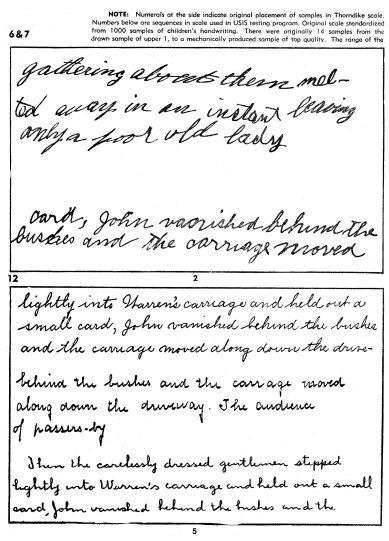
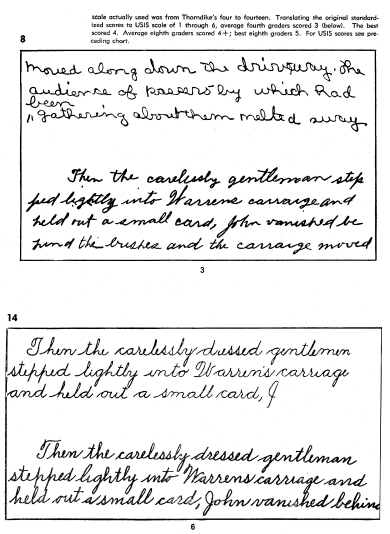
with samples selected from the Thorndike Handwriting Scale, shown in Figure
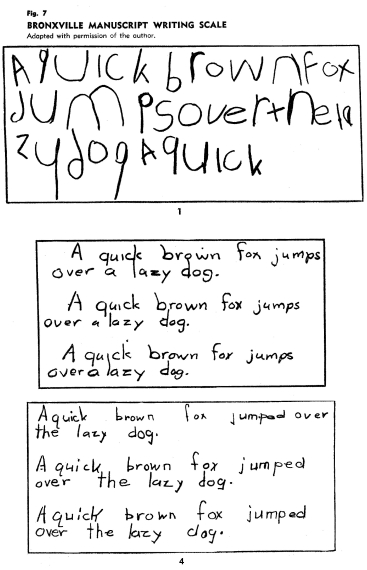
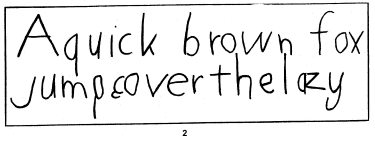
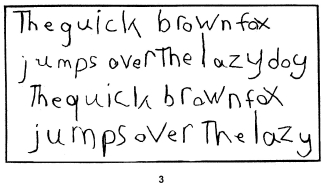
V-6. The samples from the Bronxville Scale of Manuscript Writing, by which
the quality of the manuscript penmanship was judged, are shown in Figure V-7.
Three classroom teachers were selected to rate the penmanship of all students
who took the Free Writing tests. In order to evaluate this method of scoring
penmanship, one hundred samples of twelfth grade penmanship were compared with
the selected samples by each of the three judges. The rating of each judge
was so indicated that his rating could not be seen by the next judge. The independent
ratings of the three judges were then compared. It was found that in no instance
did all three judges disagree as to the quality of the penmanship and, in no
instance did the judge who disagreed with the other two deviate more than one
point on the selected scale. In seventeen instances, one of the three judges
disagreed with the other two. In 83 instances there was unanimous agreement.
The method was repeated with 100 samples of the writing of fourth grade students,
again with 100 samples of students of different grade levels, and again with
students who used manuscript writing. The results each time were almost identical.
The disagreements never exceeded that of the first experiment and there were
never less than fifteen disagreements.
It was found that some of the disagreement resulted from difference
in opinions of the judges in regard to the merit or lack of merit
of flourishes, and "Spencerian type" of
writing which did not fit on the scales selected. The primary grade
teacher was somewhat more sensitive to "drawn" writing
than were the secondary teachers. Recording first impressions appeared
to result in at least as high reliability as careful analysis of
the sample.
The rating assigned to the penmanship represents the independent
agreement of at least two of the three judges. It is of interest
to note that the time required to obtain three independent judgments
of approximately. 4,000 papers, including the recording of the
ratings, was 10 days, or 240 man-hours.
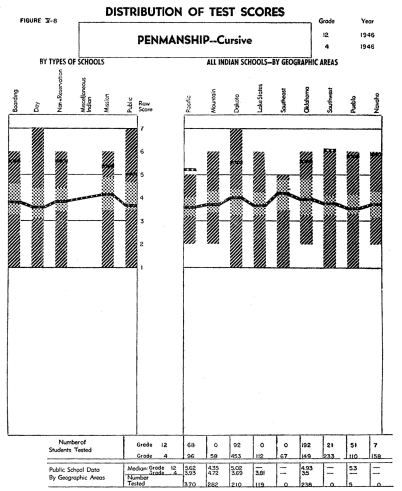
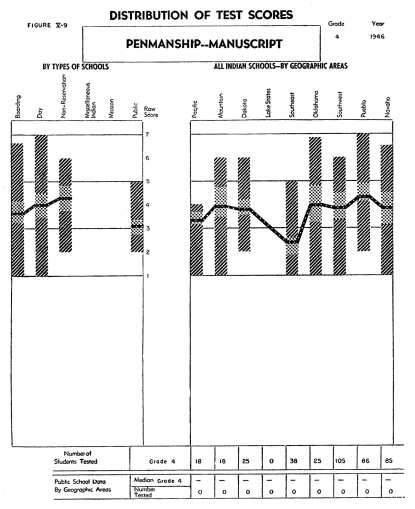
Norms for the quality of penmanship of the fourth and twelfth grade
students are shown by Figures V-8 and V-9. The number of students
at the twelfth grade level who elected to use manuscript penmanship
was too small to permit computation of norms for that grade.
** See Appendix A for details of the revision
of the test
|