Slide #4
|
English / |
In order to tap into a variety of learning styles the glacier information is organized into a slide lecture including not only photographs, but maps, graphs, and scientific illustrations. The last few slides are of the Peter's Glacier, used in the next exercise to teach map skills and to calculate its flow rate during the 1986-87 surging episode. This activity is presented with special thanks to Dennis Trabant from the USGS Water Resources Division and Keith Echelmeyer from the UAF Geophysical Institute for providing slides, aerials photos, and lots of ideas and information. |

Slide #4
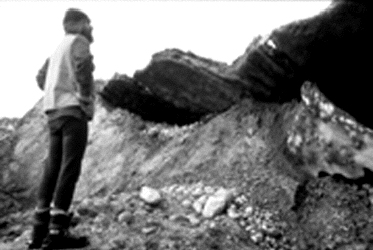
A hanging glacier terminus with a researcher standing under the cliff-like terminus. Glaciers that are advancing rapidly often have moraines with abrupt faces full of poorly sorted glacial till that has been pushed forward by the glacier.
Previous Slide -|- Back to Glaciers -|- Next Slide
Back to Observing Snow