High School Mathematics Problems from Alaska
A database
of lessons and units searchable by content and cultural standards,
cultural region and grade level. More units will be available soon.
You can use Acrobat Reader to look at the PDF version of the Cover
Sheet
for the Units and Self-Assessment
for Cultural Standards in Practice.
Reading
a Graph:
Azimuth Range vs. Day in Barrow, Alaska
(Problem Three)
James H. Grey
jgrey@northstar.k12.ak.us
MS
Word Download
Standards:
Geometry,
Functions and Relationships; Statistics/Probability.
Performance
Standards: A4.3.1,
A4.4.2, A4.3.4, A5.3.5, A5.4.3, A5.4.6, A6.3.4
Concepts:
Interpreting
graphical information, slope, x and y intercepts, writing a linear
equation from graphical information, predictions based upon
trends.
Carnegie
Chapter: Finding
an Equation from Its Graph.
Overview:
Focusing on
reading and interpreting information from a graph.
Teacher
Notes:
It may help to
do problem one first and carry over the information to this
problem.
Reading a Graph -
Azimuth Range vs. Day in Barrow, Alaska Problem Three
The directions on a
compass correspond to numbers from 0-360 as shown below where North
corresponds to 0 degrees, East is 90 degrees, South is 180 degrees,
and West is 270 degrees. This is known as azimuth - if an object is
at an azimuth of 45 degrees it is in the Northeast direction relative
to an observer.

Azimuth
Range shows the TOTAL arc the sun traverses in the sky each day.
On February 14, the sun rises (comes above the horizon) at an azimuth
of 131.4 degrees and sets (goes below the horizon) at an azimuth of
229.3 degrees in Barrow, Alaska. This gives an Azimuth Range (the
difference between the sunrise and sunset azimuth) of 97.9 degrees
for that day.
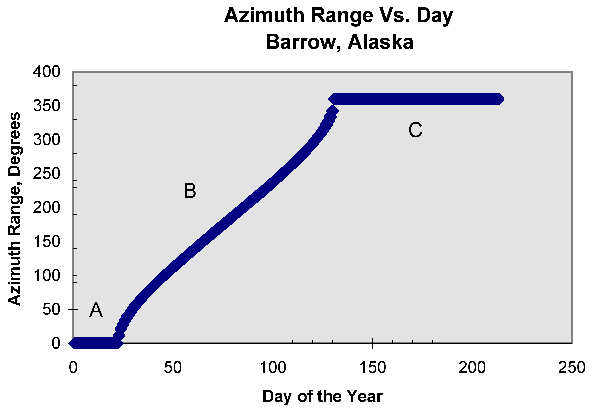
The graph below
shows the Azimuth Range, in degrees, the sun traverses in the sky
each day in Barrow, Alaska.

Use the information
above to answer the following questions in complete sentences.
- According to
the graph, what is the sun doing in the first, horizontal part
(A)?
- What
does the second, inclined part (B), of the graph
signify?
- What is
happening in the third, horizontal part (C), of the
graph?
- Describe each
lettered part of the graph in terms of its slope. (Remember, slope
equals rate of change.)
A.
B.
C.
- Extend the
curve of part B so that it intersects both the x and
y-axis.
- What
is the x-intercept of B and what is its meaning?
- What is the
y-intercept of B and what is its meaning?
- a) What is the
equation of line A?
b) What is
the equation of line C?
- Name two
ordered pairs on curve B.
- Using
the ordered pairs, write the equation of the line that fits
B.
- Predict what
the graph will do next, after part C. Why?
Table of
Contents
For the Teacher's Guides, please email Alaska
Native Knowledge Network
Handbook
for Culturally Responsive Science Curriculum by Sidney Stephens
Excerpt: "The information and insights contained in this document will be
of interest to anyone involved in bringing local knowledge to bear in school
curriculum. Drawing upon the efforts of many people over a period of several
years, Sidney Stephens has managed to distill and synthesize the critical ingredients
for making the teaching of science relevant and meaningful in culturally adaptable
ways." |